You signed in with another tab or window. Reload to refresh your session.You signed out in another tab or window. Reload to refresh your session.You switched accounts on another tab or window. Reload to refresh your session.Dismiss alert
# Using this reponsitory to realize 3 functions:
1. Generate a MODEL to evaluate stereochemical quality of a given protein structure (with coordinates);
2. Using interacted plot to view distribution of phi and psi of a single protein, a chain even a residue, or more;
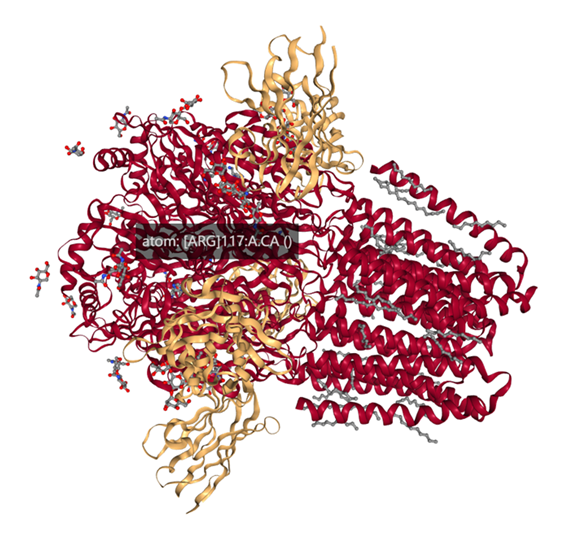
3. 3D structure of the choosed .pdb file
Pre-processing
See details in 合并df.zip
data cleaning and merge.
Verify the data with Biopython output.

RAMAplot model
See details in code_for_RAMA_plot.ipynb
References: Morris AL, MacArthur MW, Hutchinson EG, Thornton JM. Stereochemical quality of protein structure coordinates. Proteins. 1992;12(4):345-364.
TOTAL WORKFLOW
Data process 1:

Data process 2 (improved methods):

Interacted plot
The plot show the phi and psi based on above total dataframe from pre-processing

Using NGLview
see details at https://github.com/nglviewer/nglview