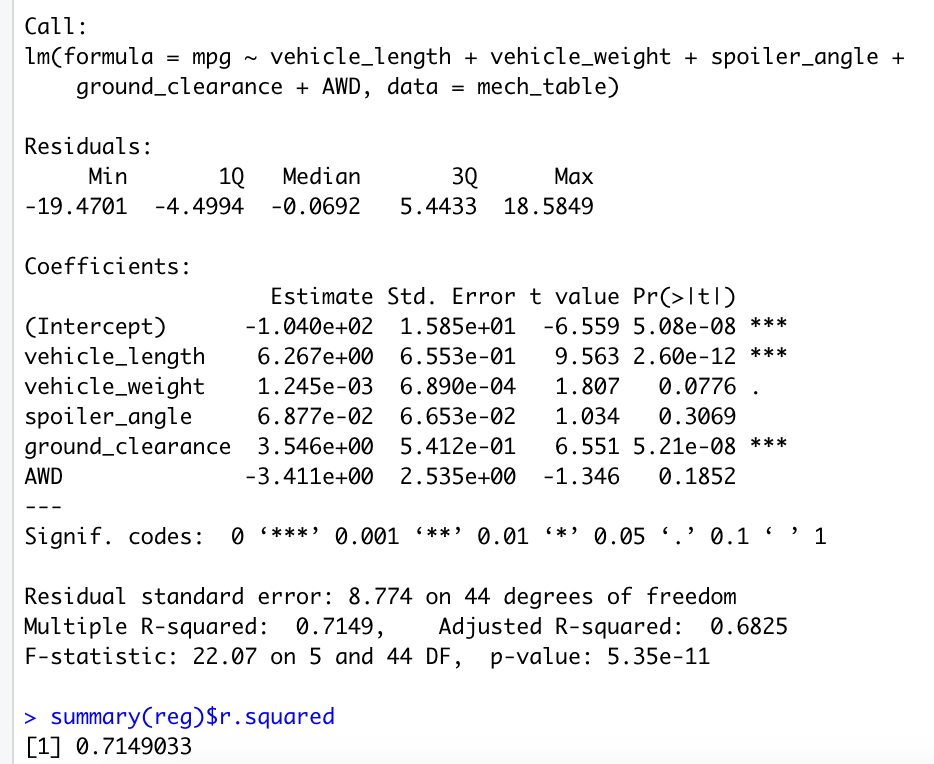
Summary: Vehicle_length and ground_clearance (as well as Intercept) variables provide non-random amount of variance to the mpg values in the dataset. The slope of this linear regression model is not zero because the p-value is 5.35 x 10⁻¹¹. This multiple linear model predicts mpg of MechaCar prototypes effectively since the calculated r-squared value is 0.71 which means there's a 71% of a strong correlation between the variables.
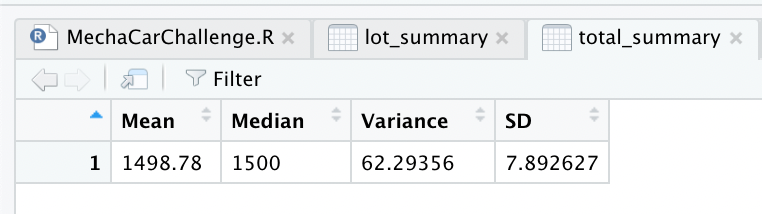
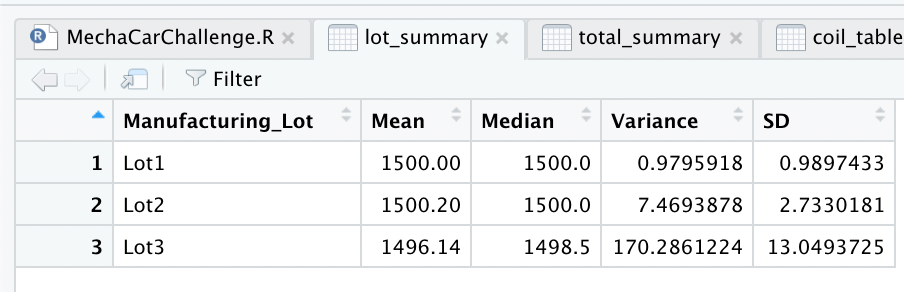
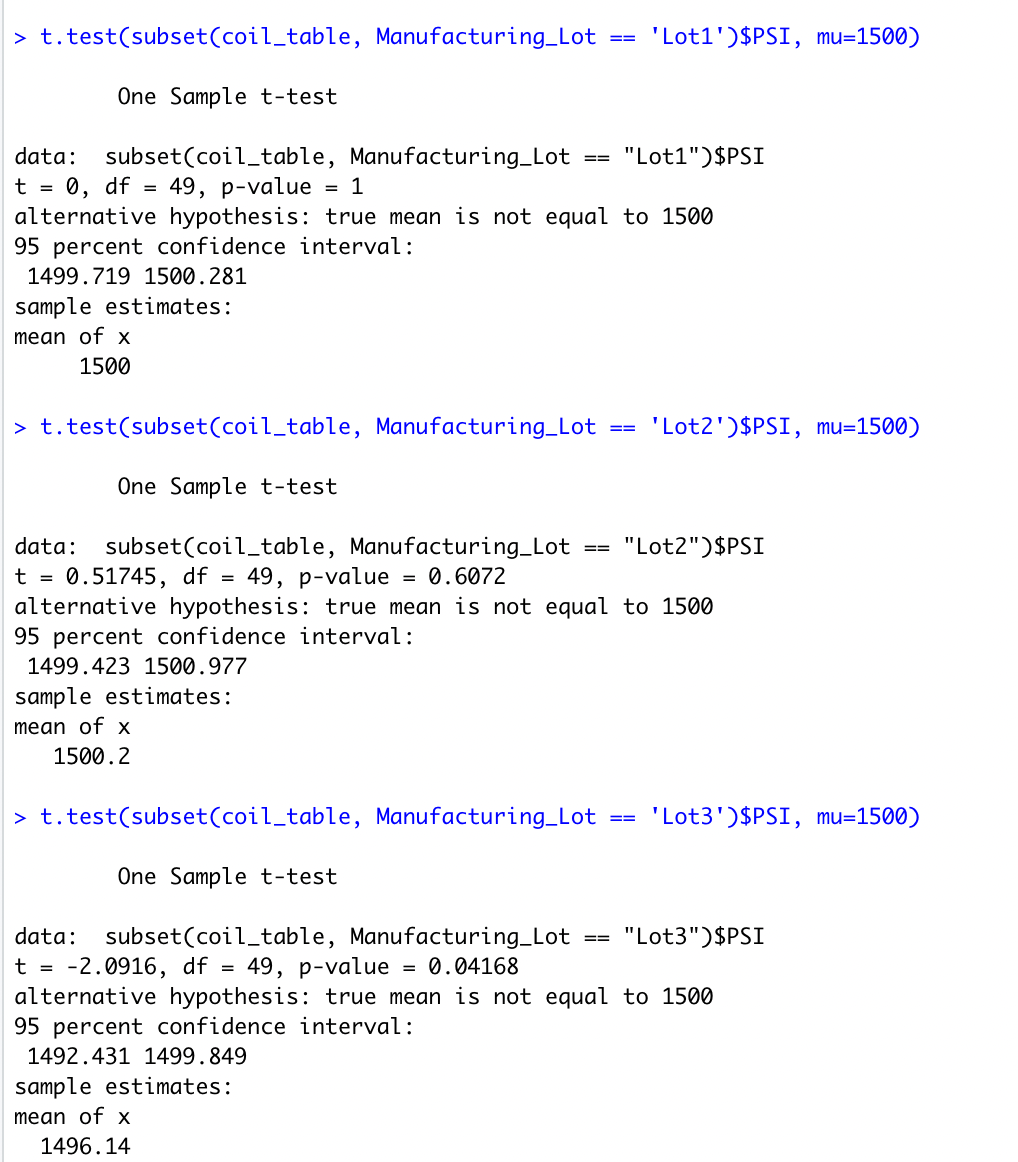
The design specifications for the MechaCar suspension coils dictate that the variance of the suspension coils must not exceed 100 pounds per square inch. The current manufacturing data for all manufacturing lots in total meets this design specification since the variance (62.3) is under 100. Although individually Manufacturing Lots 1 and 2 also meet the specification, however, Manufacturing Lot 3 does not since it exceeds the limitation by over 70 pounds per square inch!
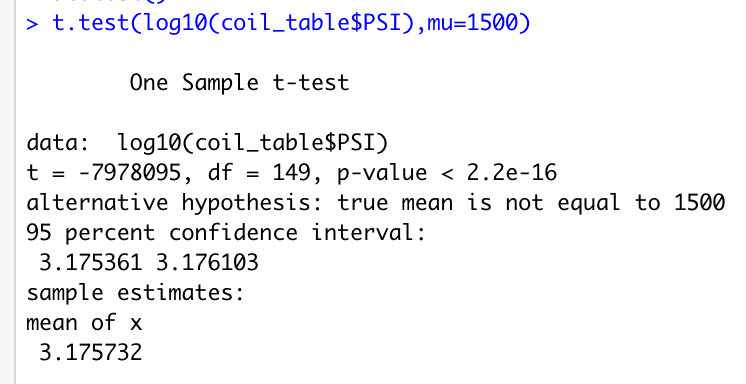 One-Sample t-Test across all manufacturing lots in the dataset. The PSI for all the lots is statistically different from the population mean of 1,500 pounds per square inch.
Another statistical study that can quantify how the MechaCar performs against the competition can be based on cost and fuel efficiency. To run this study we would need to find the mean, median, standard deviation, and variance of each metric for about 150-200 cars. The null hypothesis would be that there is no correlation between these variables. The alternative being that the cost variable depends on fuel efficiency value. To test the hypothesis, we can perform a multiple linear regression model since this can provide a more in-depth calculation of the p-value and a one-sample t-test to determine if the variable(s) are statistically different from the populaton.