


Operational Dashboard Using Grafana to monitor and visualize the metrics of a Java Spring Boot application.
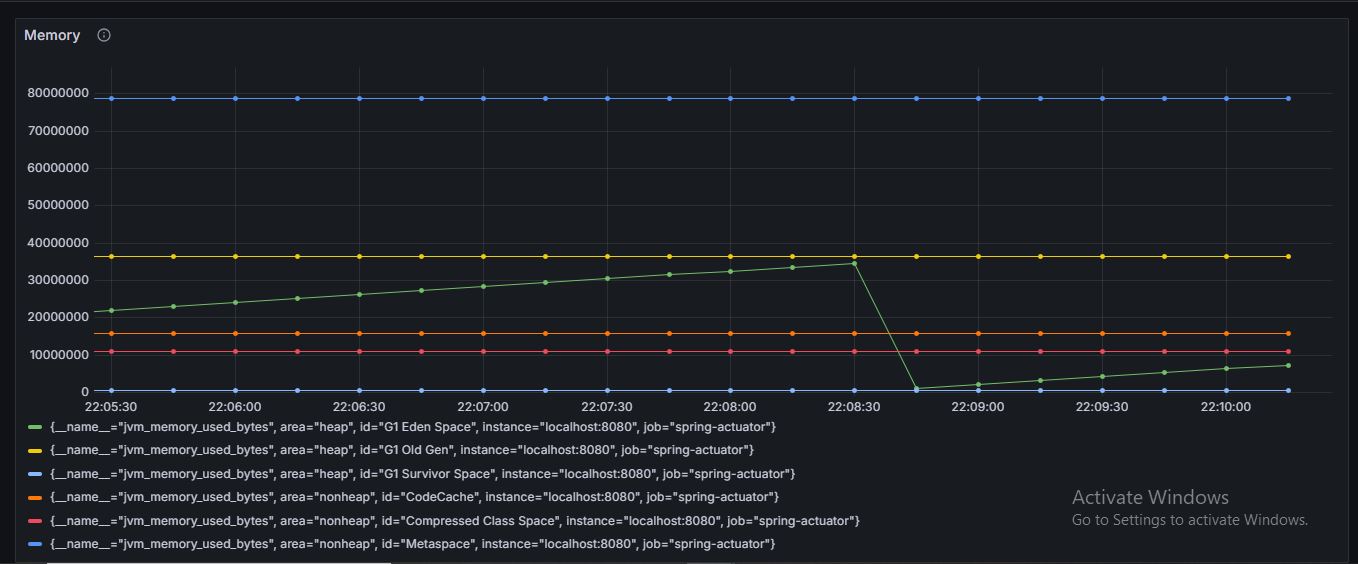
Memory Usage data
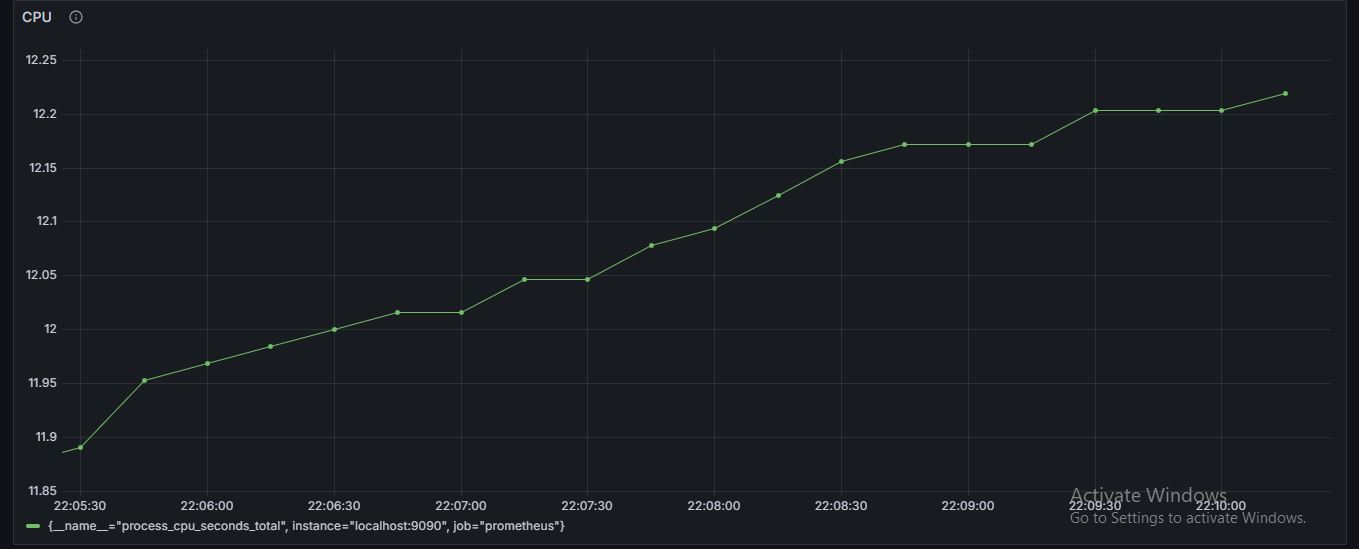
CPU Utilization
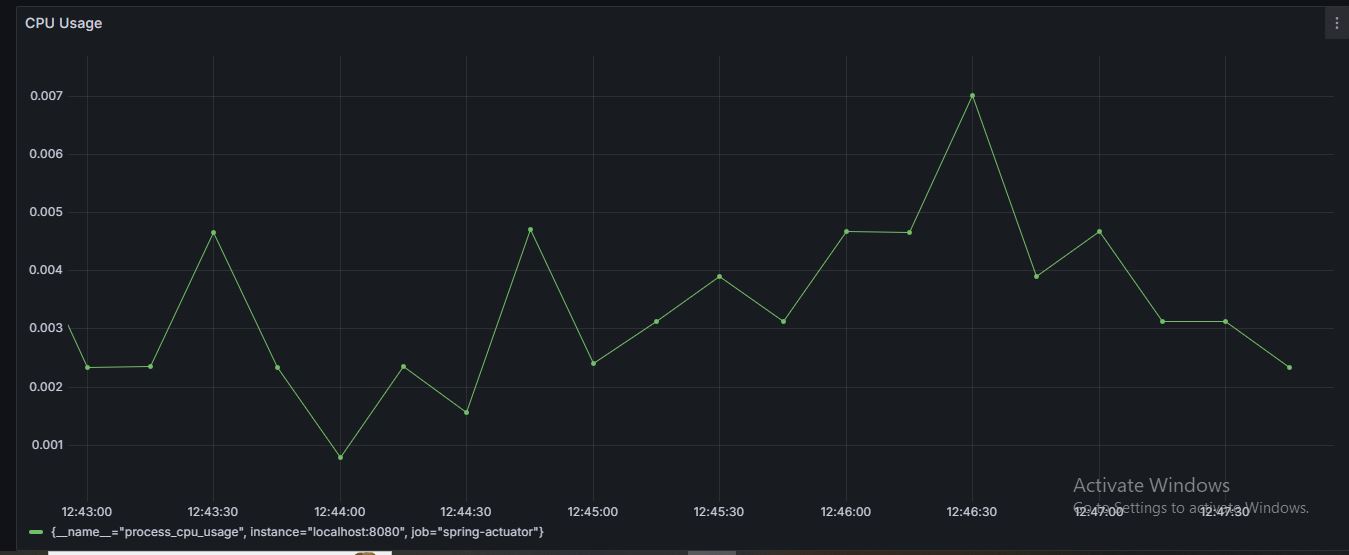
CPU Usage
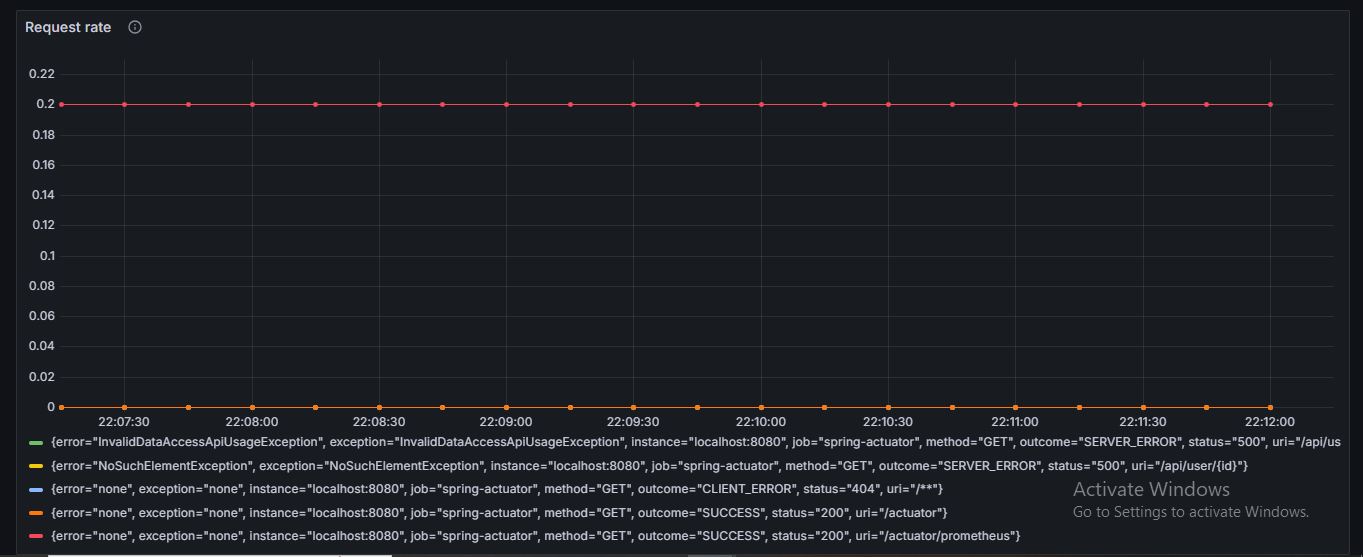
Request Rate data
Response time data
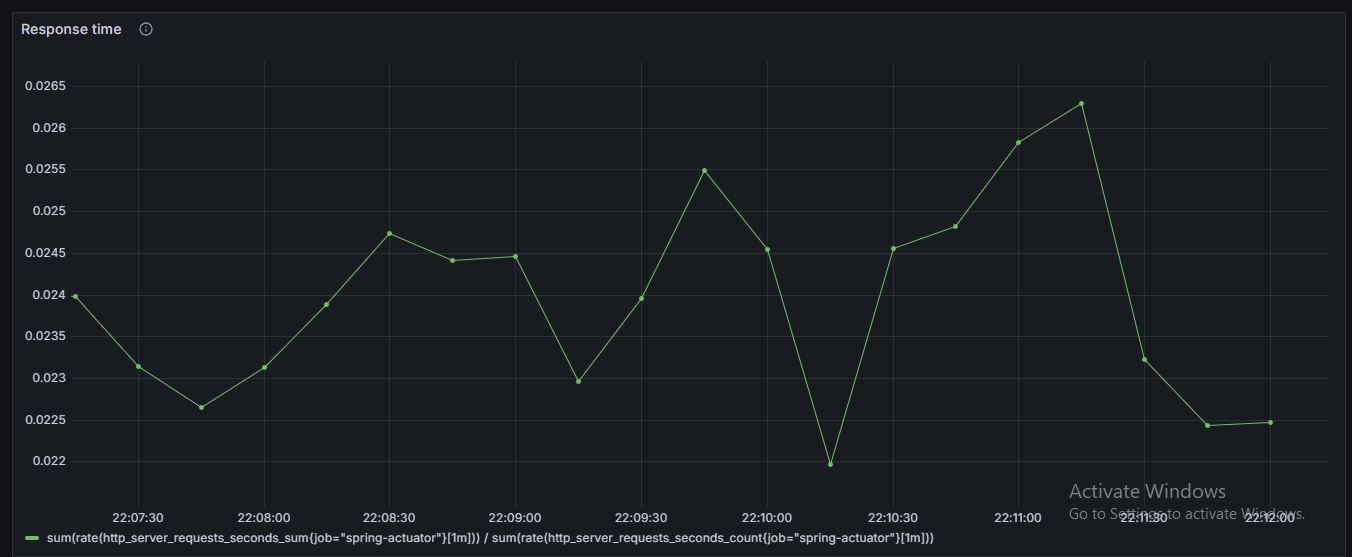
- Data visualization dashborad using Grafana and Prometheus
- Request rate: Number of requests per minute.
- Response time: Average response time of the requests.
- Error rate: Percentage of requests that resulted in errors.
- System load: CPU and memory utilization
Download .JSON file from the project for reference
application.properties
spring.application.name=MonitorHealthApp
management.endpoints.web.exposure.include=*
management.endpoint.health.show-details=alwaysClone the project
git clone https://github.com/subhajit51193/DashboardVisualApp.git
Go inside project directory
cd DashboardVisualApp
cd MonitorHealthApp
Install dependencies
mvn clean install
Start Server
mvn spring-boot:run
Install prometheus Server
Update prometheus.yml file with extra configurations
  - job_name: "spring-actuator"
    metrics_path: "/actuator/prometheus"
    scrape_interval: 5s
    static_configs:
    - targets: ["localhost:8080"]
Run below command from Command Prompt or Powershell from same file path where yml file is located to start prometheus server(9090)[Windows]
.\prometheus.exe
Run below command from Terminal from same file path where yml file is located to start prometheus server(9090)[Mac]
./prometheus
Now we can open the prometheus server by going to localhost:9090 and choose our metrices
Now install grafana
Go inside bin folder of grafana and open command prompt or powershell and type following command to run grafana server(3000)[Windows]
.\grafana-server.exe
Go inside bin folder of grafana and open Terminal and type following command to run grafana server(3000)[Mac]
./grafana server
Now grafana dashboard will open with default username and password - admin
Now go to add datasource
Choose prometheus
In url section - http://localhost:9090
Click save and test button
Now the dashboard is ready . We can choose any metrices from prometheus and paste in Metrics browser panel to run query and see data
Client: Java, SpringBoot
DataBase: H2
Server: Embedded Tomcat,Promethues,Grafana