| Document | Purpose |
|---|---|
| ARCHITECTURE.md | Component design, data flow, BPF internals |
| CONTRIBUTING.md | How to add probe types, submit PRs |
| examples/ | Ready-to-use YAML probe configs |
An eBPF-based Linux syscall and performance tracer built with C and Go.


Tracery attaches eBPF probes to running Linux processes and streams syscall activity, latency measurements, memory events, and scheduler activity in real time.
Unlike strace, Tracery does not stop the target process on every syscall.
Instrumentation runs inside the kernel through eBPF, enabling low-overhead
observability without code changes or restarts.
# 1. Install build dependencies (clang, Go, libbpf, bpftool)
curl -fsSL https://raw.githubusercontent.com/riyacore404/tracery/main/setup.sh | sudo bash

# 2. Clone and build
git clone https://github.com/riyacore404/tracery.git
cd tracery
make all

# 3. Run
bash workload.sh &
sudo ./tracery count --pid $!curl -fsSL https://github.com/riyacore404/tracery/releases/latest/download/tracery_0.1.0_linux_arm64.tar.gz | tar xz
sudo ./tracery --help- Live syscall frequency tracking
- Syscall latency histograms
- Memory event tracing (
mmap,munmap,brk) - Scheduler context-switch monitoring
- Structured JSON output
- Ring-buffer-based event streaming
- BPF CO-RE portability across Linux kernel versions
| Tool | Mechanism | Wall time vs. baseline | Overhead | Structured Output |
|---|---|---|---|---|
| Baseline | — | 72–76s (3 clean runs) | — | — |
strace -f |
ptrace | 46–282s across runs | 2×–6× slower, highly variable | No |
| perf | sampling | ~5–15% | Low | Limited |
| Tracery | eBPF | ~same as baseline | <3% (within measurement noise) | Yes |
Measured on a resource-constrained VirtualBox VM (4 vCPU, 3.2GB RAM,
Ubuntu 24.04, kernel 6.x). Tracery's wall-clock time consistently tracked
the untraced baseline within noise across all runs. strace -f's overhead
varied substantially between runs (2×–6×) — -f (follow forks) is
memory-hungry, and on this VM, free -h showed swap actively in use during
benchmark runs, which compounds strace's already-high cost non-linearly.
The qualitative result — eBPF-based tracing adds negligible overhead while
ptrace-based tracing materially and unpredictably slows execution — held
across every run; the exact multiplier is sensitive to available memory and
will be re-measured on a cleaner/bare-metal host in a future update.
Note on hardware counters:
perf_event_open(PERF_COUNT_HW_INSTRUCTIONS)requires bare-metal or a PMU-enabled hypervisor. On VirtualBox and many cloud VMs, hardware counters are not exposed;tracery bench --pid <pid>detects this and points you totracery bench --workload "<cmd>"for a wall-clock measurement instead, rather than printing a result it can't actually measure.
Workload: bash workload.sh (100k iterations of cat /dev/null), measured on
Ubuntu 24.04, kernel 6.x, VirtualBox VM. strace was run with -o /dev/null
(suppressed output) — full terminal output mode is worse.
The strace slowdown is structural: ptrace stops the target process on every
syscall entry and exit, causing two context switches per syscall. Tracery's
eBPF programs run inside the kernel and write to a ring buffer without stopping
the process.
Note on hardware counters:
perf_event_open(PERF_COUNT_HW_INSTRUCTIONS)requires bare-metal or a PMU-enabled hypervisor. On VirtualBox and many cloud VMs, hardware counters are not exposed. Wall-clock timing across 3 repeated runs is used here as the primary metric; it is reproducible and sufficient for demonstrating the overhead difference. On bare metal, instruction-count deltas confirm the same result.
Live syscall frequency table.
sudo tracery count --pid 1234

sudo tracery count \
  --pid 1234 \
  --output json

sudo tracery count \
  --pid 1234 \
  --interval 3
Example output:
SYSCALL        COUNT
---------------------
read           15234
write           8201
futex           4312
epoll_wait      2987
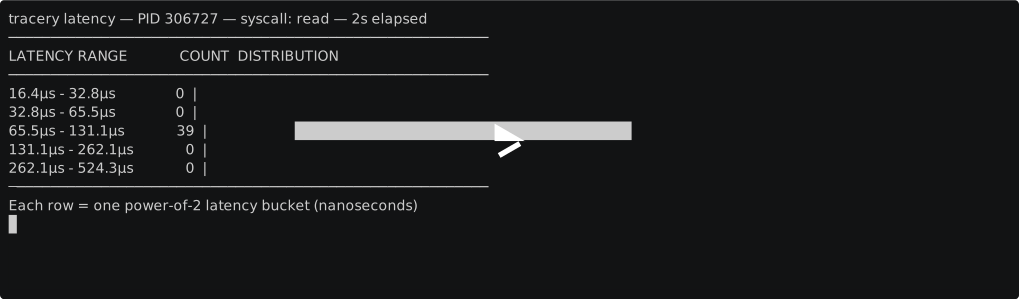
Measure syscall execution latency.
sudo tracery latency --pid 1234 --syscall read

sudo tracery latency --pid 1234 --syscall write

sudo tracery latency --pid 1234 --syscall openat
Latency is measured using entry/exit probe pairs and
bpf_ktime_get_ns().
Example histogram:
1-2 us     | ######
2-4 us     | ###########
4-8 us     | #################
8-16 us    | ######
16-32 us   | ##
Run a YAML-defined set of probes — the most flexible command. Supports kernel-side probes (tracepoints, kprobes) and user-space probes (uprobes) in the same config format.
sudo tracery trace --config examples/uprobe-latency.yaml --pid 1234

sudo tracery trace --config examples/uprobe-latency.yaml --pid 1234 --dry-run
Supported probe types:
| Type | Hook Point | Use Case |
|---|---|---|
tracepoint |
Stable kernel tracepoints | Preferred for kernel events — stable across kernel versions |
kprobe |
Dynamic kernel function entry | When no tracepoint exists |
kprobe_pair |
kprobe entry + exit | Kernel-side latency measurement |
uprobe |
User-space function entry, by symbol name | Trace a specific function inside any running binary, no recompilation needed |
uprobe_pair |
User-space function entry + exit | Latency measurement on a user-space function call |
uretprobe |
User-space function return only | Capture return values without measuring latency |
Example output (uprobe_pair against a traced function):
Tracing main.handleRequest in /usr/local/bin/myservice (PID 1234) — Ctrl+C to stop
[UPROBE_PAIR] pid=1234 latency=10187223ns retval=3
[UPROBE_PAIR] pid=1234 latency=10494057ns retval=3
✓ 14 events captured
Note:
uprobe_pairanduretprobeattach a return-probe trampoline that can crash Go binaries due to interaction with Go's stack-moving garbage collector. Use plainuprobe(entry-only) when tracing Go targets.uprobe_pair/uretprobework cleanly against C/C++/Rust binaries with fixed stacks.
Stream kernel events in real time.
sudo tracery events --pid 1234 --type mem

sudo tracery events --pid 1234 --type sched

sudo tracery events --pid 1234 --type all
Supported event categories:
- Memory allocation events
- Memory mapping events
- Scheduler context switches
Live full-screen TUI combining syscall counts, a latency histogram, and
a real-time event stream into one tabbed view — built on top of the same
BPF pollers used by count, latency, and events, so there's no
duplicated kernel-attach logic between the plain CLI commands and the TUI.
sudo tracery dashboard --pid 1234
sudo tracery dashboard --pid 1234 --syscall clone
Keys: 1 / 2 / 3 or Tab to switch views, q or Ctrl+C to quit.
The --syscall flag controls which syscall the Latency tab tracks
(default: read). Pick whichever syscall is actually frequent in your
target workload — e.g. clone for fork-heavy workloads, read for I/O-bound
ones — otherwise the Latency tab will show "(no data yet)" if the default
syscall is rarely called by the traced process.
Example output (Syscalls tab):
tracery dashboard    pid=247747
Syscalls   Latency   Events

SYSCALL                  COUNT
─────────────────────────────────
rt_sigprocmask           845768  ████████████████████████████████████████
rt_sigaction             153776  ████████
wait4                    153776  ████████
rt_sigreturn              76888  ████
ioctl                     76888  ████
clone                     76888  ████

[1] syscalls  [2] latency  [3] events  [tab] switch  [q] quit
Built with Bubble Tea.
+------------------------------------------------------------------+
|                          USER SPACE                              |
|                                                                  |
|  tracery CLI (Go + Cobra)                                        |
|          |                                                       |
|          v                                                       |
|  internal/bpf/loader.go                                          |
|          |                                                       |
|          v                                                       |
|  Ring Buffer Consumer                                            |
|          |                                                       |
|          v                                                       |
|  Output Renderer (table / JSON / event log)                      |
+------------------------------------------------------------------+
                     |
                     | cilium/ebpf
                     v
+------------------------------------------------------------------+
|                         KERNEL SPACE                             |
|                                                                  |
|  tracepoint/raw_syscalls/sys_enter                               |
|  tracepoint/raw_syscalls/sys_exit                                |
|  tracepoint/syscalls/sys_enter_mmap                              |
|  tracepoint/sched/sched_switch                                   |
|          |                                                       |
|          v                                                       |
|  eBPF Programs (C)                                               |
|          |                                                       |
|          v                                                       |
|  BPF Maps                                                        |
|   • Hash maps                                                    |
|   • Array maps                                                   |
|   • Ring buffers                                                 |
+------------------------------------------------------------------+
- eBPF program runs on syscall entry.
- Counter is incremented in a hash map keyed by syscall ID.
- Userspace periodically reads map contents.
- Results are sorted and rendered.
- Syscall entry timestamp is stored in a hash map keyed by TID.
- Syscall exit retrieves the timestamp.
- Latency is calculated.
- Appropriate histogram bucket is incremented.
- Userspace renders histogram output.
- Kernel events are written into a ring buffer.
- Userspace consumes events.
- Events are decoded into typed Go structures.
- Output is streamed to the terminal.
eBPF is the Linux kernel's sandboxed virtual machine for running instrumentation programs.
Programs are:
- Written in restricted C
- Compiled to BPF bytecode
- Verified by the kernel before loading
The verifier ensures programs:
- Cannot access arbitrary memory
- Cannot crash the kernel
- Cannot execute unbounded loops
Tracery uses Compile Once – Run Everywhere (CO-RE).
Kernel type information is provided through BTF (BPF Type Format). During program loading, field offsets are relocated to match the running kernel version.
This allows the same compiled eBPF object to run across multiple Linux kernel releases without recompilation.
Tracery uses BPF_MAP_TYPE_RINGBUF for event delivery.
Benefits:
- Lock-free communication
- Efficient kernel-to-userspace transfer
- Ordered event streaming
- Minimal synchronization overhead
- Linux kernel 5.8+
- BTF enabled
ls /sys/kernel/btf/vmlinux- Go 1.22+
- clang
- llvm
- bpftool
- Root privileges or CAP_BPF
git clone https://github.com/riyacore404/tracery.git

cd tracery

make all

sudo ./tracery --helptracery/
├── bpf/
│ ├── syscall_counter.bpf.c
│ ├── latency.bpf.c
│ ├── events.bpf.c
| ├── stack.bpf.c
│ ├── uprobe.bpf.c
│ ├── events.h
│ └── vmlinux.h
│
├── internal/
| ├── aggregator/
│ │ ├── types.go
| | └── uprobe.go
| |
| ├── output/
│ │ ├── flamegraph.go
| | └── symbols.go
| |
| ├── probe/
│ │ ├── uprobe.go
| | └── yaml.go
| |
│ ├── bpf/
| | ├── loader.go
| | └── poll.go — shared BPF attach + poll logic
│ │ (PollSyscallCounts, PollLatencyHistogram, PollEvents)
| ├── logger/
│ | └── logger.go
| |
│ └── tui/
│ ├── model.go — Bubble Tea Model/Update/View
│ ├── styles.go
│ ├── syscalls_view.go
│ ├── latency_view.go
│ └── events_view.go
│
├── count.go
├── latency.go
├── events.go
├── dashboard.go
├── main.go
└── Makefile
- YAML-based probe definitions
- Speedscope flamegraph JSON export
- Benchmark command (
tracery bench) - GitHub Actions CI
- Goreleaser single-binary releases
- User-space function tracing (uprobes, uprobe_pair, uretprobe)
- ELF symbol resolution for uprobe attachment
- Interactive TUI dashboard (Bubble Tea) — tabbed syscalls/latency/events view, shares pollers with CLI commands
- Network event tracing
- Container-aware filtering
- Hardware PMU overhead measurement on bare-metal (instruction-count delta via
perf_event_open) - Stack-safe uretprobe handling for managed runtimes (Go, JVM)
- Dashboard: auto-select highest-frequency syscall for the Latency tab instead of requiring --syscall
GPL-2.0
Tracery is licensed under GPL-2.0, matching licensing requirements commonly used by Linux kernel eBPF tooling.