"Jellyjoin: the softest of joins."
Join dataframes or lists based on semantic similarity.


Jellyjoin does "soft joins" based not on exact matches, but on approximate similarity. It uses a cost-based optimization to find the "best" match. It can use older string similarity metrics as well, but using an embedding model allows semantic similarity to be used and gives very robust and high-quality matches.
By default, jellyjoin will attempt to use OpenAI embedding models to calculate similarity if you have the openai
package installed and an OPENAI_API_KEY in the environment. If that fails, it uses Damerau-Levenshtein similarity,
a string distance metric suitable for a wide range of use cases.
(You can, of course, fully specify the similarity strategy to use a different embedding model or similarity metric;
this is covered in the Advanced Usage section below.)
pip install jellyjoinFirst, set up the OPENAI_API_KEY environment variable if you want to use the OpenAI embedding models (recommended.)
You can also configure a custom SimilarityStrategy if you want to use another embedding model or other string
comparison metric.
Then the most basic way to use jellyjoin is to simply pass it two lists:
import jellyjoin

association_df = jellyjoin.jellyjoin(
    ["Introduction", "Mathematical Methods", "Empirical Validation", "Anticipating Criticisms", "Future Work"],
    ["Abstract", "Experimental Results", "Proposed Extensions", "Theoretical Modeling", "Limitations"],
)
It always returns the result as a Pandas DataFrame, with the left index, right index, similarity score. If you pass lists or other iterables, it will name the columns for the values "Left Value" and "Right Value".
| Left | Right | Similarity | Left Value | Right Value |
|---|---|---|---|---|
| 0 | 0 | 0.689429 | Introduction | Abstract |
| 1 | 3 | 0.403029 | Mathematical Methods | Theoretical Modeling |
| 2 | 1 | 0.504316 | Empirical Validation | Experimental Results |
| 3 | 4 | 0.415846 | Anticipating Criticisms | Limitations |
| 4 | 2 | 0.478649 | Future Work | Proposed Extensions |
Jellyjoin also provides some rudimentary utilities for visualizing these associations:
from jellyjoin.plots import plot_associations

plot_associations(association_df)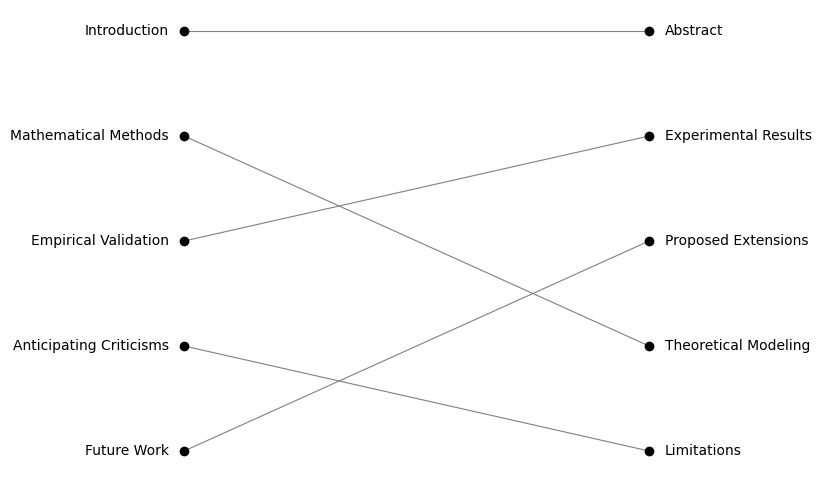
from jellyjoin.plots import plot_similarity_matrix

plot_similarity_matrix(similarity_matrix)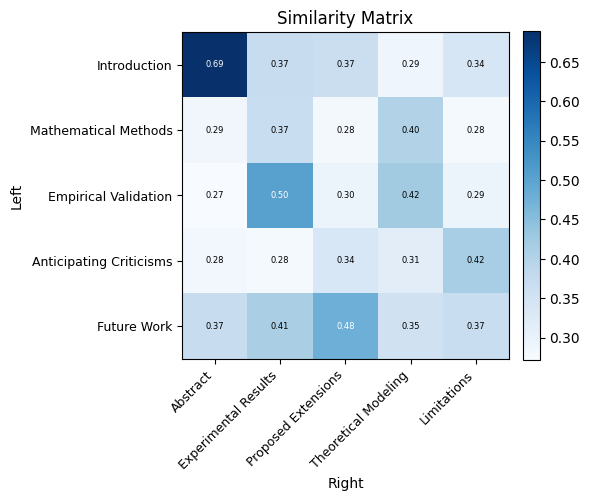
Often, though, your records will have multiple fields, so jellyjoin is designed to work
on Pandas DataFrames.
Let's say we have a list of database columns:
| Column Name | Type |
|---|---|
| user.email | text |
| user.touch_count | integer |
| user.propensity_score | numeric |
| user.ltv | numeric(10, 2) |
| user.purchase_count | integer |
| account.status_code | char(1) |
| account.age | integer |
| account.total_purchase_count | integer |
And we want to associate them to these front-end fields:
| Field Name | Type |
|---|---|
| Recent Touch Events | number |
| Total Touch Events | number |
| Account Age (Years) | number |
| User Propensity Score | number |
| Estimated Lifetime Value ($) | currency |
| Account Status | string |
| Number of Purchases | number |
| Freetext Notes | string |
We can do that by passing in the two dataframes. (The columns could be explicitly specified, but by default it uses the first column.) Since some of the columns and fields don't match to anything, we'll also specify a threshold so that only "pretty good" matches or better will be returned.
jellyjoin.jellyjoin(left_df, right_df, threshold=0.4)| Left | Right | Similarity | Column Name | Type_left | Field Name | Type_right |
|---|---|---|---|---|---|---|
| 1 | 0 | 0.471828 | user.touch_count | integer | Recent Touch Events | number |
| 2 | 3 | 0.819823 | user.propensity_score | numeric | User Propensity Score | number |
| 3 | 4 | 0.476054 | user.ltv | numeric(10, 2) | Estimated Lifetime Value ($) | currency |
| 4 | 6 | 0.74174 | user.purchase_count | integer | Number of Purchases | number |
| 5 | 5 | 0.606886 | account.status_code | char(1) | Account Status | string |
| 6 | 2 | 0.556893 | account.age | integer | Account Age (Years) | number |
This only shows the single best match above a threshold of 0.4, which is useful if you want reliable, one-to-one matches. To include rows that didn't match
in the result, specify how you want to join: left, right, or outer. This option works the same way as the how option in pandas.merge():
jellyjoin.jellyjoin(left_df, right_df, threshold=0.4, how="outer")| Left | Right | Similarity | Column Name | Type_left | Field Name | Type_right |
|---|---|---|---|---|---|---|
| 0 | nan | nan | user.email | text | nan | nan |
| 1 | 0 | 0.471828 | user.touch_count | integer | Recent Touch Events | number |
| 2 | 3 | 0.819823 | user.propensity_score | numeric | User Propensity Score | number |
| 3 | 4 | 0.475964 | user.ltv | numeric(10, 2) | Estimated Lifetime Value ($) | currency |
| 4 | 6 | 0.741805 | user.purchase_count | integer | Number of Purchases | number |
| 5 | 5 | 0.606886 | account.status_code | char(1) | Account Status | string |
| 6 | 2 | 0.556831 | account.age | integer | Account Age (Years) | number |
| 7 | nan | nan | account.total_purchase_count | integer | nan | nan |
| nan | 1 | nan | nan | nan | Total Touch Events | number |
| nan | 7 | nan | nan | nan | Freetext Notes | string |
These join types show the missing rows, but they are still orphaned (not joined to anything) because by default the algorithm only takes
the single best match. These results will show nan values (Pandas' equivalent of NULL in SQL) for columns on the other side of the join.
To get one-to-many, many-to-one, or many-to-many matches, specify the allow_many option: left, right, or both.
jellyjoin.jellyjoin(left_df, right_df, threshold=0.4, how="outer", allow_many="both")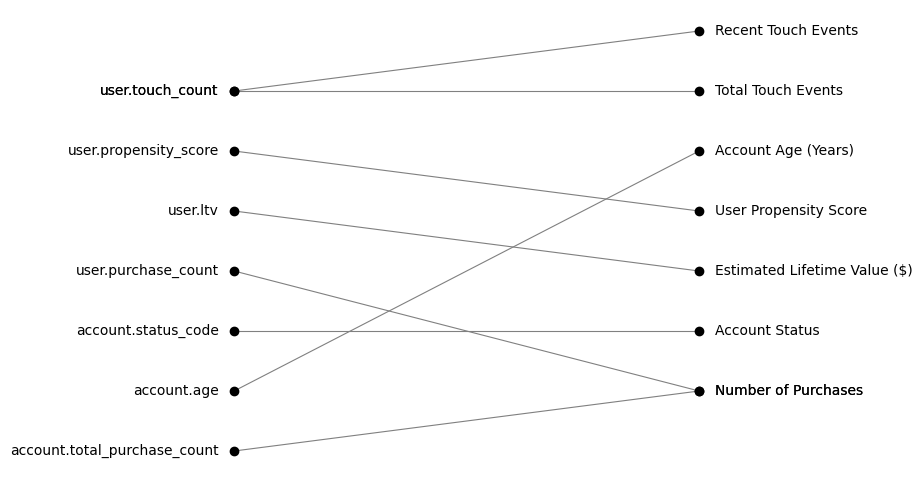
Records that don't join to anything on the other side (with a similarity greater than the threshold) will still be left unjoined.
Jellyjoin can use traditional string distance metrics, but is really designed to use a semantic vector embedding model. The tricky part is getting the embedding vectors.
If you already have OpenAI, Azure OpenAI or Ollama as dependencies for your project, you can use those; otherwise I recommend using Nomic. You can read more about configuring these, or even writing your own, in this guide:
If your project doesn't have an embedding model already, I recommend starting with the local Nomic model.
Given N strings on the left and M strings on the right, Jellyjoin only makes O(N + M) embedding calls; after that,
taking the outer product to obtain the full NxM matrix of all possible comparisons is very fast; then the Hungarian
algorithm lets us find the best possible matches in roughly O(N^3) (assuming N <= M) which is also fast for
reasonable N. Jellyjoin uses scipy.linear_sum_assignment under the hood, which is implements Jonker-Volgenant,
(the currently best known algorithm) and is competitive with over similar solvers. The bottom line is, the embedding
model is likely going to be the bottleneck until truely large N.
To set up a development environment:
git clone https://github.com/olooney/jellyjoin.git
cd jellyjoin
pip install -e .[dev]
The jellyjoin unit tests skip test cases that can't be run due to missing optional dependencies, so to run the full test suite:
- Set up a valid
OPENAI_API_KEYas an environment variable or place it in a.dotenvfile somewhere it can be found bydotenv. - Ensure the "nomic-embed-text-v1.5" weights are downloaded and cached.
- Start a local ollama server running and pull the "nomic-embed-text:v1.5" model.
Run tests:
pytestJellyjoin uses pre-commit to run various linters and the ty type checker. Make
sure you run:
pre-commit installto register pre-commit with git.