
- Maria Christina Maniou @mcmaniou
- Zoi Chatzichristodoulou @zoichatzi
The goal of the present work is to discover abnormalities in two-dimensional data using linear complexity clustering techniques as a foundation. The solution performs effectively and effi-ciently in datasets with well-formed cycloid clusters. The solution has been implemented in Apache Spark using Scala.
The present work is a project that was created in the context of “MINING FROM MASSIVE DATASETS” class.
MSc Data and Web Science, School of Informatics, Aristotle University of Thessaloniki.
The original motive for creating computers was to solve difficulties in science and engineering. After an extended period, computer science remains the prima-ry field in which breakthrough ideas and technology are produced and used. Also, as a result of the amazing advancements in computer technology, data are being created in unprecedented quantities. In reality, the number of organized and unstructured digital datasets is expected to skyrocket. Databases, file systems, data streams, social media, and data repositories are becom-ing more common and distributed. As data size grows, we must face new issues and tackle ever-larger problems. Because of the rising availability of enormous volumes of data, new discoveries will be made and more accurate investigations will be con-ducted. Scientific fields that do not fully utilize the massive volumes of digital data accessible today risk missing out on the great potential that big data may provide. One of the machine learning fields that is affected by the rapid increase in data size is anomaly detection techniques as to be considered complete they require many iterative checks of the data and therefore sky-rocketing the complexity. The purpose of anomaly de-tection is to find outliers in data that seems to be simi-lar. Anomaly detection is a useful technique for identi-fying fraud, network intrusion, and other uncommon occurrences that may be relevant but are difficult to notice and for this reason it is prohibitive to adopt techniques that take days or even weeks to run [3]. In this work we present the implementation of a scala-ble approach of cluster-based outlier detection tech-nique that performs in linear runtime.
The original dataset D consists of approximately 47.000 non-negative two-dimension points that form six well-formed convex polygons as Figure 1 depicts.

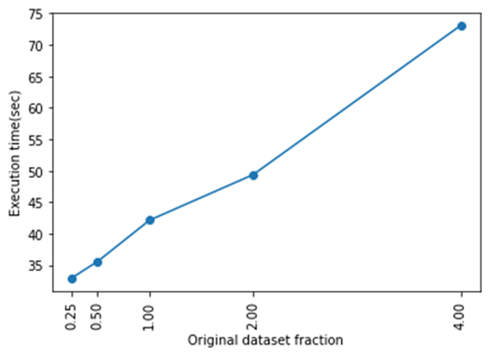
In order to check the scalability of the run time of our approach the need to test it to subsets and supersets of the original data set came up. In particular, the perfor-mance of our method will be tested in two different categories where random points have been removed or added respectively. The sets will constitute:
- A quarter of the original set (25%)
- Half of the original set (50%)
- Twice the original (200%)
- Four times the original (400%)
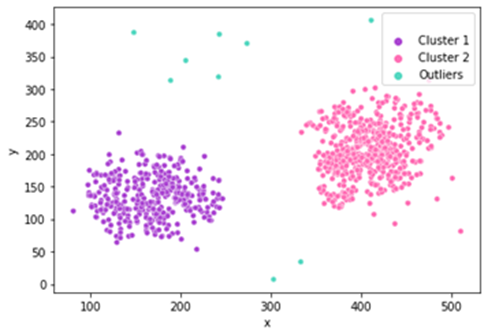
In order to examine the functionality of the present algorithm in a different set and simultaneously to ex-amine the performance of this approach in terms of accuracy and recall, we will test it in a dataset for which we know the grand truth. This set consists of 876 items which are divided into 2 clusters (pink and purple). The dataset has 9 pre-marked ectopic points which are marked in blue-green color as Figure depicts.
As the data are synthetic there was no need for extensive pre-processing of the data. There fore the bellow steps were followed:
- Remove the NULL values
- Normalize the data using a MinMax scaler
- Rescale each feature to range [0, 1]
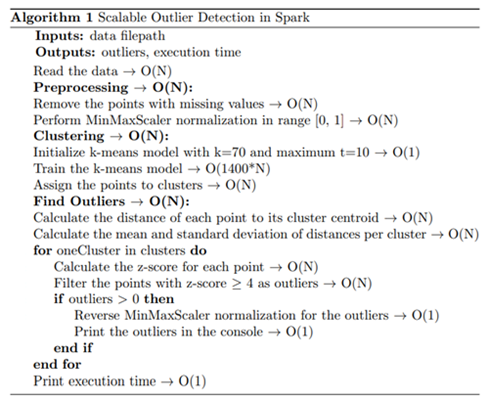
The first step consists of removing the points with missing values and normalizing the data in the range of [0, 1]. The latter is a necessary step in distance-based algorithms and ensures that no dimension prevails in the calculations. The second step is to train a k-means model to perform the clustering. The main intuition is that outliers are the points with the largest distance from the centroids and given the non-cyclical nature of the clusters pre-sented in the previous Figure, if we set a large enough number of clusters, we will be able to find the outliers. With re-gard to Eq. 1, we set k = 70 and t= 10, so for a 2-dimensional dataset k-means has a complexity of.
O(N*k*t*d) (1)
The third step is to use the trained model to make the predictions. Afterwards, the distance of each data point to its cluster centroid is calculated, as well as the mean and standard deviation of the distances per cluster. The last ones are used to calculate the z-score of its dis-tance. The points with z-score equal to or greater than 4 are considered as outliers. The last step is to reverse the initial normalization of the outliers and print them to the console. The above described steps are presented in detail in the following Figure.
Comparison between all approaches.
| Dataset | # points | Presision | Recall | Runtime (sec) |
|---|---|---|---|---|
| Original (400%) | 188.000 |
1 |
1 |
73.020051405 |
| Original (200%) | 94.000 |
1 |
1 |
49.346912155 |
| Original (All) | 47.000 |
1 |
1 |
42.109486233 |
| Original (50%) | 23.500 |
1 |
1 |
35.566625094 |
| Original (25%) | 11.750 |
1 |
1 |
32.941732741 |
| outliers | 876 |
0.6428 |
1.000 |
21.45921544 |
[1] Rettig, L., Khayati, M., Cudré-Mauroux, P., Pior-kówski, M. (2019). Online Anomaly Detection over Big Data Streams. In: Braschler, M., Stadelmann, T., Stockinger, K. (eds) Applied Data Science. Springer, Cham. https://doi.org/10.1007/978-3-030-11821-1_16
[2] MacQueen, J. B. (1967). Some methods for classifi-cation and analysis of multivariate observations. In L. M. Le Cam & J. Neyman (Eds.), Proceedings of the fifth Berkeley symposium on mathematical statistics and probability (Vol. 1, pp. 281–297). California: Uni-versity of California Press.
[3] Lloyd, S. P. (1957). Least squares quantization in PCM. Technical Report RR-5497, Bell Lab, September 1957.
[4] Bradley PS, Fayyad UM, Reina C (1998) Scaling clustering algorithms to large databases. In: KDD, pp 9–15
- Account for streaming data.
- Streaming data approach suggestions.
- Optimize # of clusters selection.
- Check on sparse data with outliers micro-clusters.