

![]()
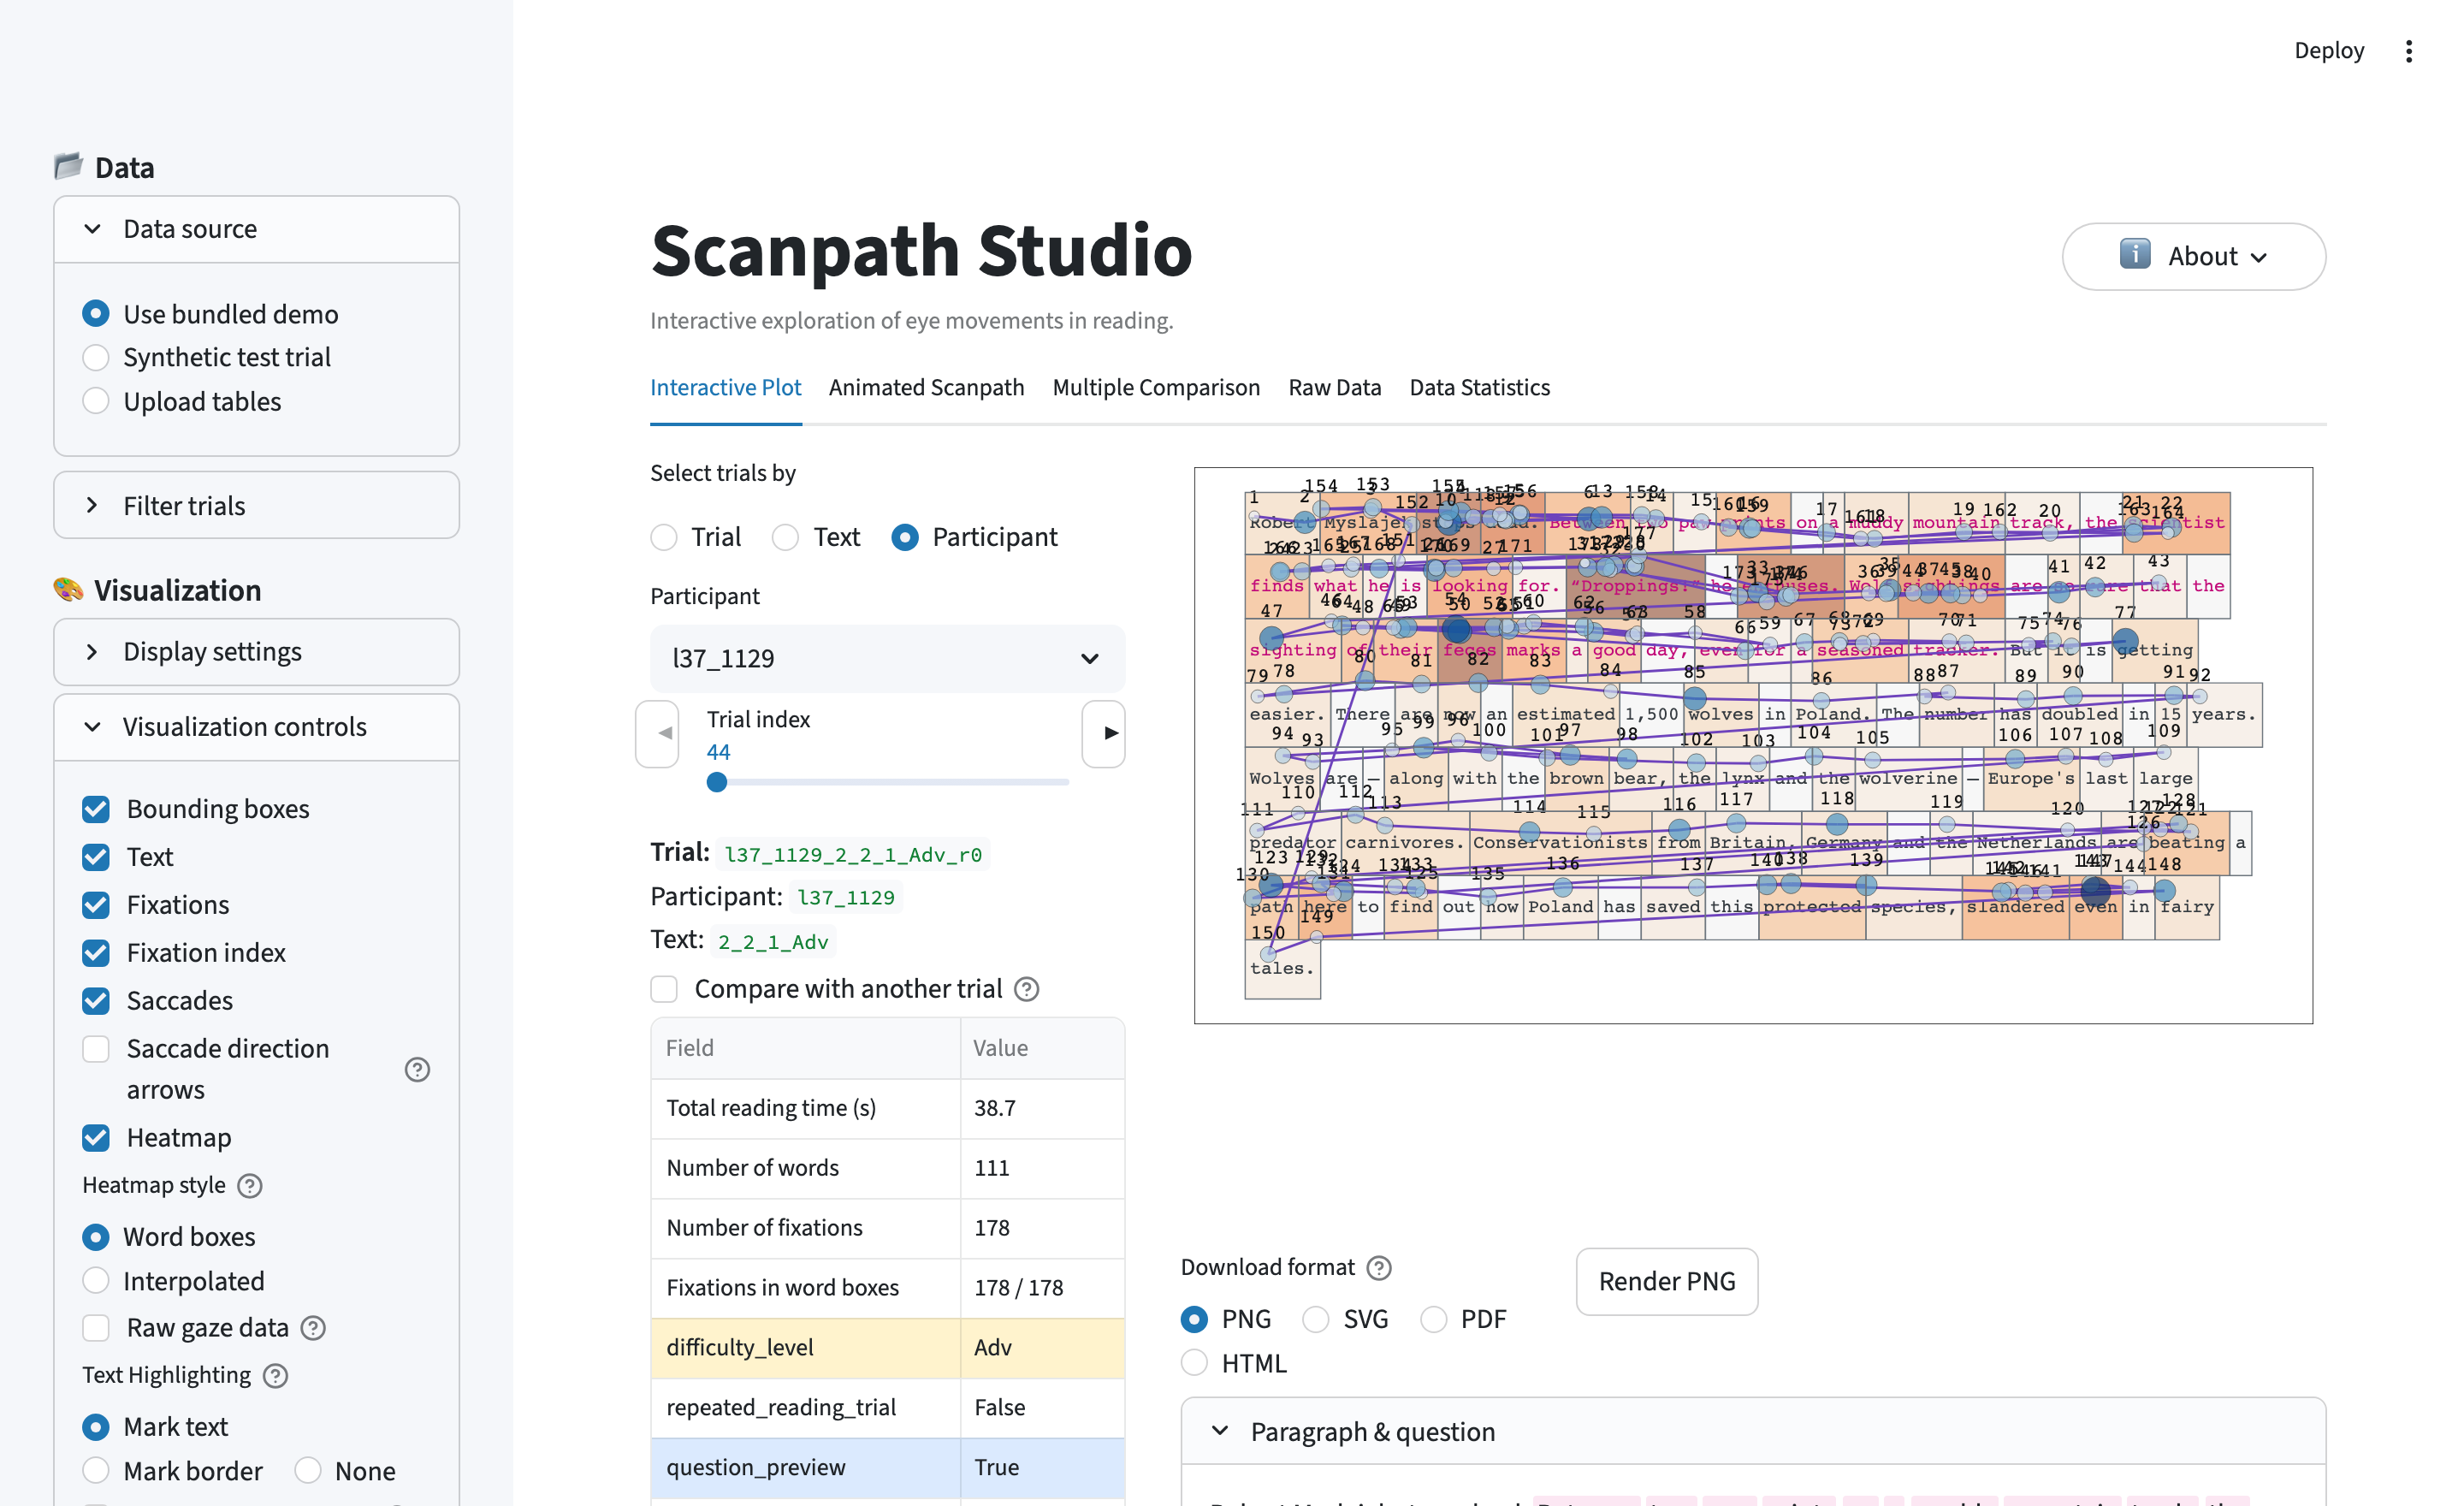
An interactive workbench for visualizing eye-tracking-while-reading data. Drop in a trial and see the scanpath the way the reader saw it — words at their true on-screen positions, with fixations, saccades, a density heatmap, and animated replay layered on top, all exportable as publication-ready figures.
It is dataset-agnostic (auto-detects EyeLink / Gazepoint / snake-case columns) and ships with a small OneStop demo, so you can try it with zero setup.
Authors: Omer Shubi, Keren Gruteke Klein, and others (TBD) — LACC Lab, Technion.
A scanpath replayed fixation by fixation over the text the reader saw.
Live demo (zero install): https://scanpath-studio.streamlit.app
pip install scanpath-studio
scanpath-studio # launches the app in your browserThe scanpath plot is built from layers you toggle independently:
- Text drawn at the exact pixel coordinates the participant saw.
- Fixations sized and colored by any column in your data (duration, GPT-2 surprisal, word frequency, …).
- Saccades, with backward jumps (regressions) standing out.
- Areas of interest (word boxes from your data) and a word-level heatmap (total fixation duration, count, …).
On top of that:
- Animated replay — watch the scanpath unfold at real or scaled speed; export as interactive HTML, GIF, or MP4.
- Compare readings — overlay two trials on one canvas or place them side by side (e.g. ordinary vs. information-seeking, first vs. repeated, L1 vs. L2).
- Critical-span, out-of-text & by-line highlights — mark an answer span, flag fixations outside every word box, or color fixations by text line.
- Triage — star, tag, and annotate trials; save and restore everything as a JSON sidecar.
- Bulk export — one zip of per-trial PNG + SVG figures, plot settings, and tabular data across every filtered trial.
Overlay a second reading to compare two readers of the same text on a shared clock.
The app is organized into three tabs:
| Tab | What's there |
|---|---|
| Scanpath Visualization | The layered scanpath: a Browse by selection row above the plot (trial / text / participant) and, beside it, a right-hand control rail with Animate and Compare toggles plus the per-layer visualization controls (style each scanpath independently). The trial's key info shows as configurable chips above the plot. Below: three subtabs — Annotations, Stimulus & questions, and Export, where Export bundles single-trial and bulk export (HTML / GIF / MP4 and figures / settings / tabular data across the filtered trials — or the whole dataset). |
| Corpus Analysis | Two subtabs: Generations (WIP) — a real scanpath vs. several model-generated ones over the same text, scored by similarity (placeholders for now); and Aggregated Views — trends of a metric by trial index and within-trial fixation index, per-text heatmaps pooled over readers, and grouped metric distributions. |
| Data Inspection | Paginated word / fixation / raw-gaze tables (CSV + Parquet download), summary statistics, and the active column mapping. |
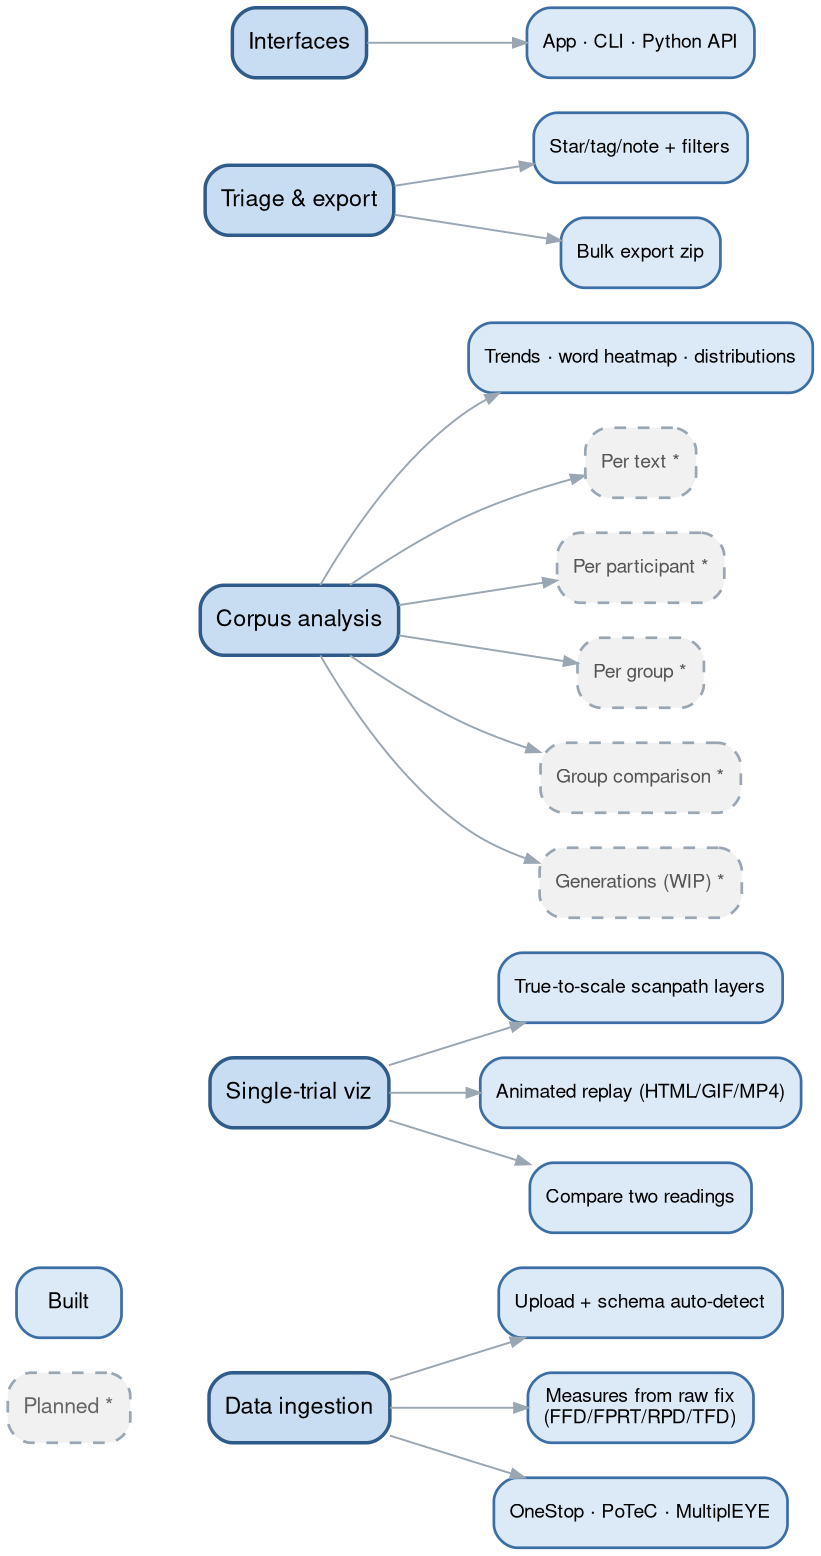
Solid = built, dashed = planned (IMPROVEMENTS.md).
Upload CSV, TSV, Parquet, or Feather tables for words/AoIs, fixations, and
(optionally) raw gaze. Columns are auto-detected from common EyeLink, Gazepoint,
and snake-case conventions; a sidebar Column mapping panel overrides any
guess. The loader bends to fit real corpora — many files per table (concatenated
with a source_file tag), a single report (words- or fixations-only),
stimulus-level word boxes broadcast across readers, and AoI-sequence fixations
placed at word/character-box centers.
If your data carries only raw fixations, the app computes the canonical per-word measures itself — FFD, FPRT (gaze duration), RPD (go-past), TFD (dwell), plus skips and regressions, following Rayner (1998) and Inhoff & Radach (1998). Pre-aggregated EyeLink columns, when present, take precedence.
A ready-made PoTeC loader (Potsdam Textbook Corpus) exercises that flexible pipeline end to end:
import scanpath_studio as sps

words, fixations = sps.load_potec("data/PoTeC", download=True)   # ~45 MB on first call
fig = sps.plot_scanpath(words, fixations, "0", "b0", canvas_size=(1680, 1050))Everything the app draws is also available headless — same pipeline, same figure.
scanpath-studio render --sample --list-trials              # what's available
scanpath-studio render --sample -o scanpath.html           # interactive HTML
scanpath-studio render --words ia.csv --fixations fix.csv -p p1 -t t3 -o figure.png
scanpath-studio render --sample --animate -o replay.html   # animated replay
import scanpath_studio as sps
words, fixations = sps.load_scanpath_data("ia.csv", "fixations.csv") # paths, globs, or lists; either table optional
sps.list_trials(words, fixations)
fig = sps.plot_scanpath(words, fixations, "p1", "t3") # every layer toggle is a kwarg
sps.save_figure(fig, "scanpath.png") # .html / .png / .svg / .pdf
measures = sps.compute_word_metrics(words, fixations) # FFD / FPRT / RPD / TFD …HTML export is browser-free; PNG/SVG/PDF/GIF/MP4 go through Kaleido (run
plotly_get_chrome -y once). See scanpath-studio render --help for all flags.
git clone https://github.com/lacclab/scanpath-studio.git
cd scanpath-studio
pip install -e ".[test]"          # or: uv sync
streamlit run streamlit_app.py
Tested on Python 3.11–3.14. Run the tests with pytest; see
AGENTS.md for an architectural overview.
Full docs — getting started, the Python API, the CLI reference, data format, and
export/troubleshooting — are at https://lacclab.github.io/scanpath-studio/
(built from docs/ with MkDocs Material). Build them locally with:
pip install -e ".[docs]"
mkdocs serveA system-demo paper is in preparation — citation TBD. Until then, cite the
software via GitHub's "Cite this repository" button (generated from
CITATION.cff).
If you use the bundled demo data, please cite the OneStop corpus:
@article{berzak2025onestop,
  title     = {{OneStop}: A 360-Participant {E}nglish Eye Tracking Dataset
               with Different Reading Regimes},
  author    = {Berzak, Yevgeni and Malmaud, Jonathan and Shubi, Omer
               and Meiri, Yoav and Lion, Ella and Levy, Roger},
  journal   = {Scientific Data},
  year      = {2025},
  publisher = {Nature Publishing Group},
  doi       = {10.1038/s41597-025-06272-2},
  url       = {https://www.nature.com/articles/s41597-025-06272-2},
}
The bundled demo is a subset of OneStop Eye Movements, used under its original license (docs).
MIT — see LICENSE.