Real-time grid carbon dashboard and demand spike simulator.
Built at HooHacks 2026.

- Live carbon intensity — Shows the current Marginal Operating Emissions Rate (MOER) for any U.S. city, normalized into a 0–100 Clean Power Score
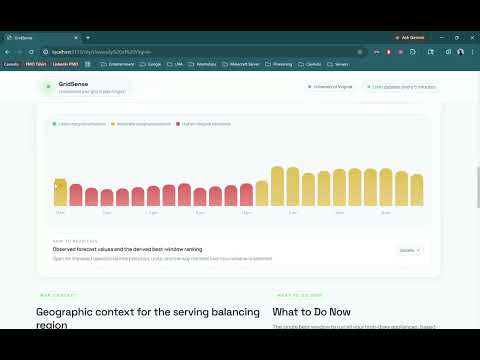
- 24-hour forecast — Hourly MOER forecast chart with automatic best 2-hour window detection
- Appliance nudges — Tells you when to run your dishwasher, EV charger, washer, and dryer to minimize carbon emissions, with per-cycle CO₂ savings
- Grid stress simulator — Side-by-side heat wave / cold snap / normal day timelines showing how load-shifting prevents grid failure
- Push alerts — Subscribe to ntfy.sh notifications when Grid Load Pressure crosses 70%


| Layer | Tools |
|---|---|
| Backend | FastAPI, Uvicorn, Pydantic, httpx |
| Data | WattTime v3 (carbon), Open-Meteo (weather), Google Maps (geocoding) |
| AI | Azure OpenAI — nudge text generation only |
| Frontend | React 18, React Router, Vite, Tailwind CSS |
| Alerts | ntfy.sh |
cp .env.example .envThe default mode is USE_MOCK_DATA=true, which runs the full dashboard and simulator with no API keys.
For live data, set these in .env:
| Variable | Purpose |
|---|---|
USE_MOCK_DATA |
Set false to enable live data sources |
WATTTIME_USER |
WattTime account username |
WATTTIME_PASSWORD |
WattTime account password |
AZURE_OPENAI_BASE_URL |
Azure OpenAI endpoint (e.g. https://your-resource.services.ai.azure.com/openai/v1/) |
AZURE_OPENAI_API_KEY |
Azure OpenAI key |
AZURE_OPENAI_DEPLOYMENT |
Deployment name (e.g. gpt-5.4-mini) |
GOOGLE_MAPS_API_KEY |
For city geocoding |
cd backend
pip install -r requirements.txt
uvicorn main:app --reload --port 8000cd frontend
npm install
npm run dev- Frontend:
http://localhost:5173 - Backend:
http://localhost:8000
| Method | Endpoint | Description |
|---|---|---|
GET |
/api/health |
Health check |
GET |
/api/intensity?city=Charlottesville |
Current MOER, Clean Power Score, weather |
GET |
/api/forecast?city=Charlottesville |
24-hour hourly forecast |
GET |
/api/weather?city=Charlottesville |
Temperature, conditions, heat-wave flag |
POST |
/api/nudges |
Appliance timing recommendations with CO₂ savings |
POST |
/api/simulate |
Grid stress simulation with load-shifting |
See overview.md for a detailed explanation of every metric — MOER, Clean Power Score, Grid Load Pressure, the simulation model, and what's observed vs. derived vs. AI-generated.