
DNA2Graph is an open-source image analysis tool for automated segmentation and classification of DNA molecules in electron microscopy images obtained by rotary shadowing.
It provides both an intuitive graphical user interface for local use and a command-line interface for scalable execution on HPC systems.
For documentation, tutorials, and sample outputs, visit the project website.

- Automated segmentation of DNA molecules in electron microscopy images.
- Two segmentation approaches:
- a standard, non-learning-based segmentation pipeline;
- a CNN-based segmentation pipeline (BETA).
- Post-processing algorithms designed to enforce biologically plausible segmentations.
- Classification of segmented molecules as:
- non-linear molecules, including branched or cyclic structures such as replication forks, Holliday junctions, bubbles, or t-loops;
- linear molecules;
- boundary molecules, located near image borders and likely incomplete.
- Export of Fiji/ImageJ-compatible ROIs for segmented molecules and bounding boxes.
- CSV export of molecule length measurements, including total molecule length and linear subregion measurements.
- Export of spatial graph representations that encode molecular topology and spatial organization for downstream analysis.
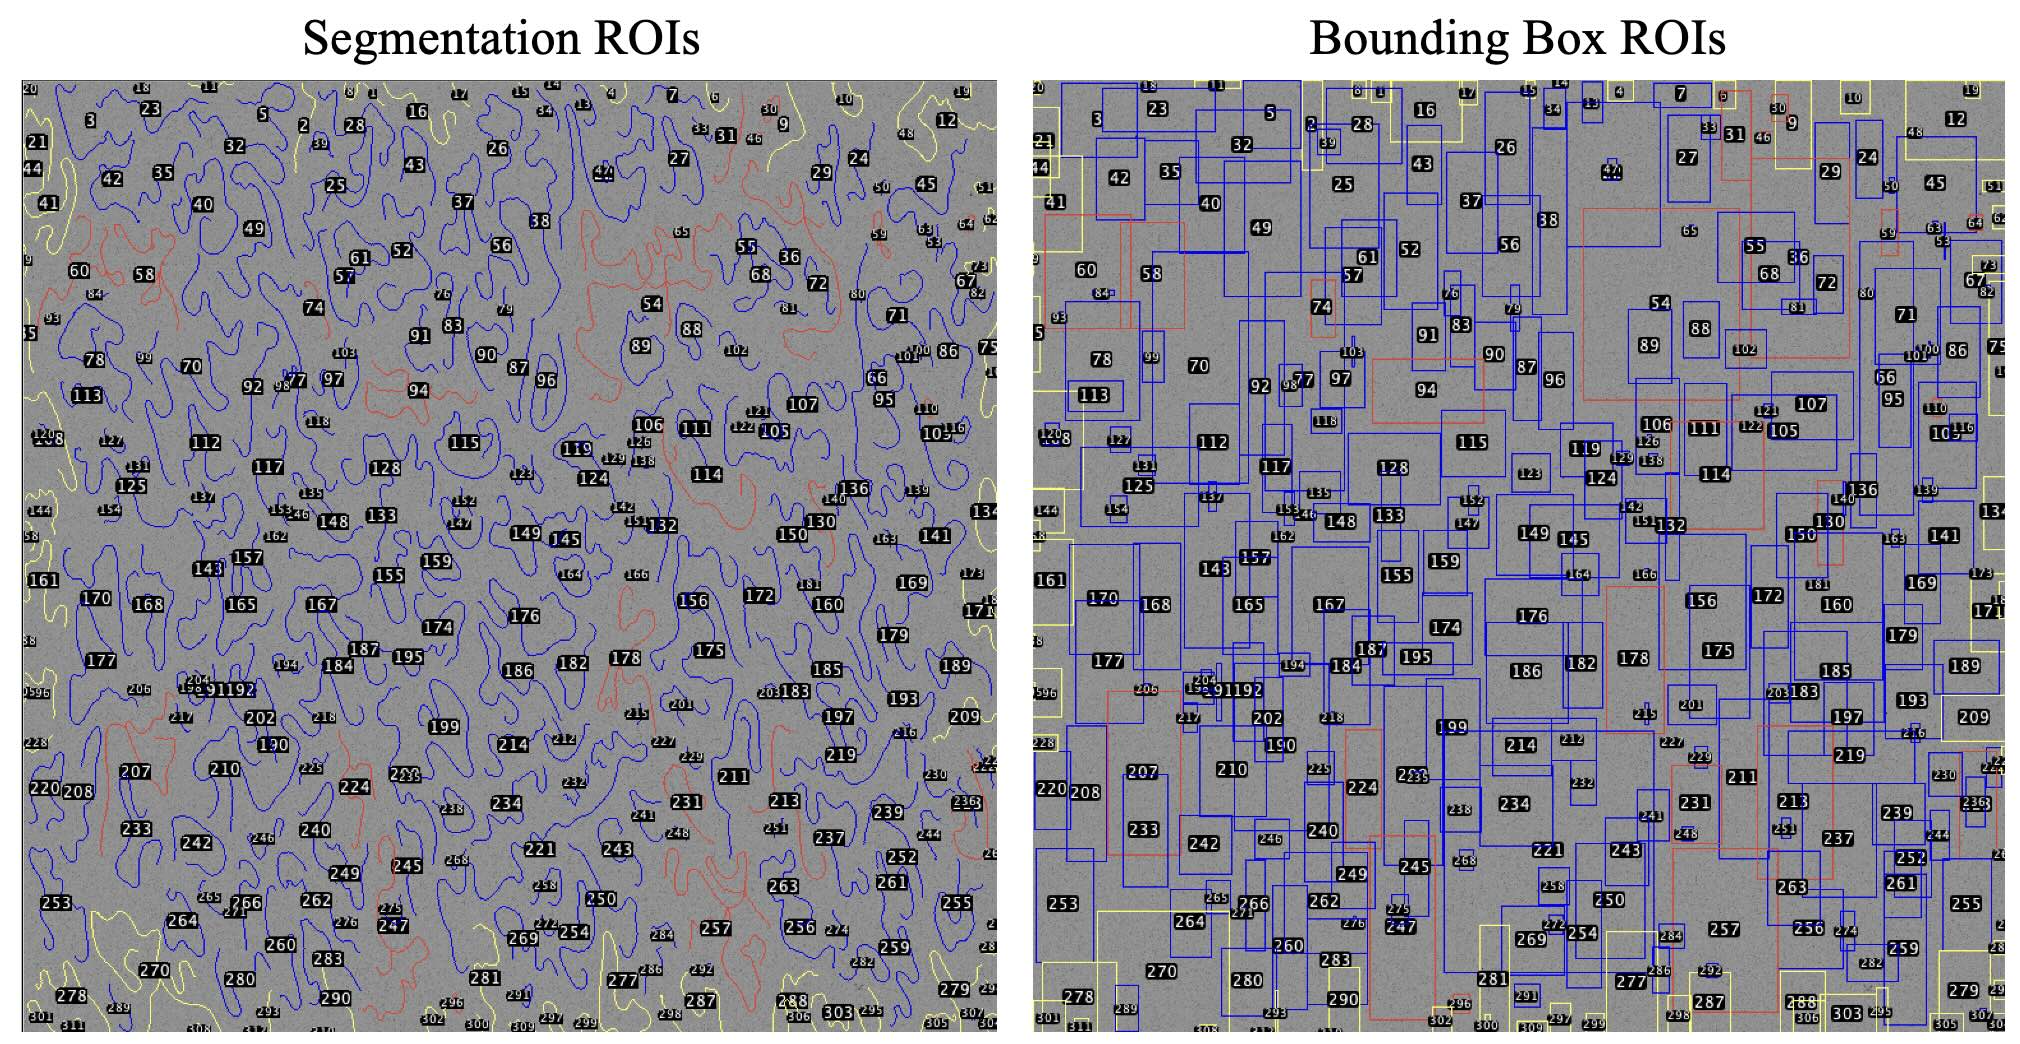
Segmentation ROIs (left) and Bounding Box ROIs (right) generated by DNA2Graph and loaded in Fiji. DNA2Graph automatically assigns each molecule to one of three groups: non-linear (red), linear (blue), or boundary (yellow).
DNA2Graph is distributed through PyPI:
pip install dna2graphThis installs both the graphical interface and the command-line interface.
To update DNA2Graph:
pip install --upgrade dna2graphLaunch the GUI with:
dna2graphDisplay the available CLI commands and options with:
dna2graph-cli --helpDNA2Graph can process large stitched electron microscopy images on a personal computer without requiring a GPU. A 20,000 x 20,000 grayscale image can be processed in approximately 1-8 minutes on an Apple M1 machine with 8 GB of RAM. For a fixed image size, runtime scales with the number of molecules present in the image.
For help with DNA2Graph, contact the project maintainer at federico.chinello@studbocconi.it or open an issue on GitHub.
F. Chinello, E. Zanella, M. Giannattasio, F. M. Buffa, and Y. Doksani.
DNA2Graph [Computer software]. Zenodo, 2026.
https://doi.org/10.5281/zenodo.20413553