This project analyzes ShopEasy's marketing data using SQL for data transformation, Python for Sentiment Analysis, and Power BI for visualization. The goal is to improve customer engagement and conversion rates by deriving key marketing insights.
- SQL Server (Data Cleaning and Transformation)
- Python (Sentiment Analysis)
- Power BI (Data Modeling and Dashboard Insights)
-
Data Extraction and Transformation
- The dataset was available as an SQL dump and imported into SQL Server.
- SQL queries were used to clean and structure the data in the form of Fact and Dimension tables.
- Sentiment analysis was performed using Python, with results stored back into SQL Server.
-
Power BI Modeling
- Data relationships were defined using a Star Schema model.
- Fact and Dimension tables were linked using Primary and Foreign keys.
-
Dashboard Creation
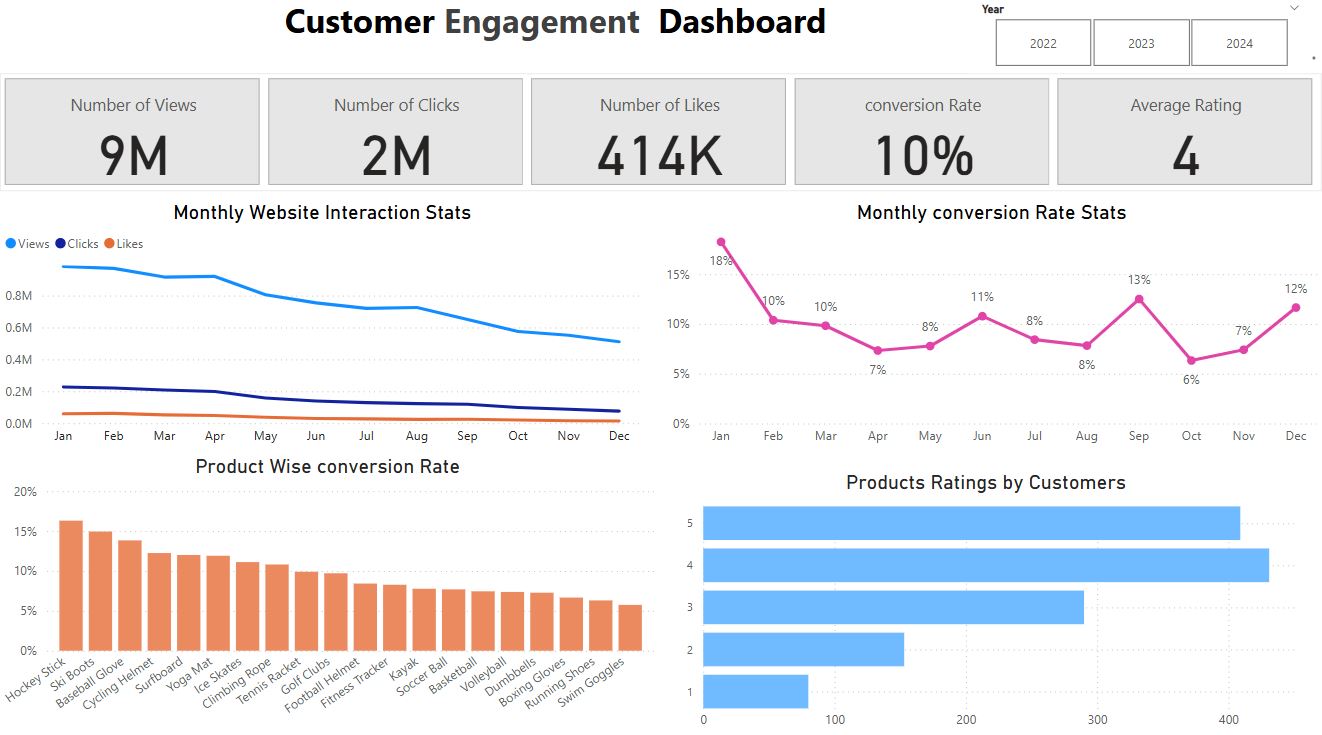
- Customer Engagement Dashboard tracks campaign performance and conversion rates.
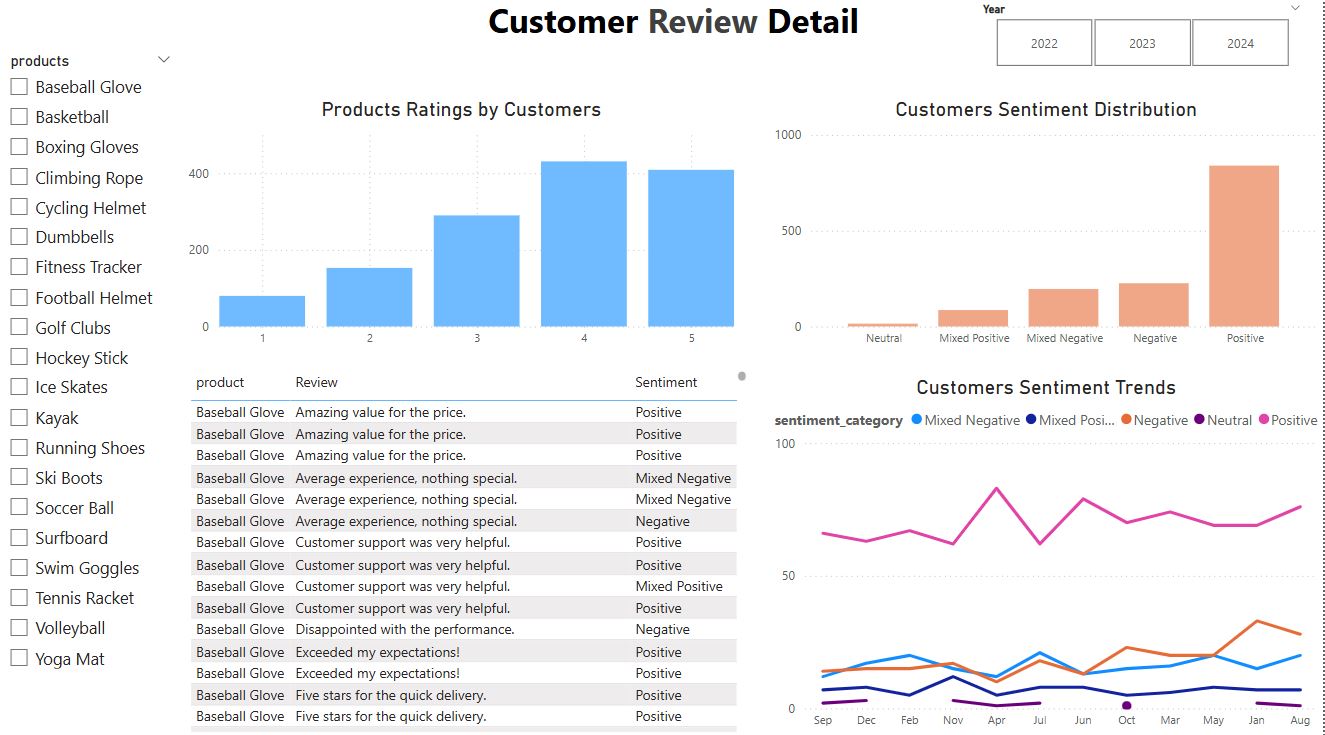
- Customer Sentiment Analysis Dashboard provides insights into positive and negative reviews.
The data model follows a Star Schema structure:
- Fact Tables: Store transactional data.
- Dimension Tables: Contain reference data used for analysis.

-
Customer Engagement
- January had the highest conversion rate (18 percent), indicating effective campaigns.
- April and October had the lowest conversion rates, suggesting areas for improvement.
-
Product Performance
- High-performing products include Hockey Stick, Baseball Glove, and Cycling Helmet.
- Low-performing products like Swim Goggles and Running Shoes need targeted marketing efforts.
-
Sentiment Analysis
- Majority of customer reviews are positive, but common negative themes include pricing concerns, delivery speed, and product durability.
- Seasonal trends affect sentiment, with spikes in negative reviews during holidays.
- Ensure Power BI Desktop is installed
- Open the
.pbixfile in Power BI - Refresh the data connection if required
- Interact with the dashboards to explore insights
This project provides actionable insights for improving marketing strategies. Let me know if you need any refinements. 🚀