Measurements of geometrical properties of kernels belonging to three different varieties of wheat. A soft X-ray technique and GRAINS package were used to construct all seven, real-valued attributes.The kernels of three varieties of wheat were examined under soft X- ray technology and a number of geometric properties were recorded. The X- ray technology is non-destructive and substantially cheaper than other imaging technologies and could possibly be used as a means to identify the variety of wheat.
This problem uses measurements of geometrical properties of kernels belonging to three different varieties of wheat. As described in the paper "Comple te Gradient Clustering Algorithm for Features Analysis of X-Ray Images" by Małgorzata Charytanowicz, Jerzy Niewczas, Piotr Kulczycki, Piotr A. Kowalski, Szymon ŁukasikS, Slawomir Żak, published in Advances in Intelligent and Soft Computing paper, machine learning is an effective at recognizing different types of wheat grains.
Tom Mitchell, a well regarded machine learning researcher, proposed precise definition in 1998: Well posed Learning Problem: A computer program is said to learn from experience E with respect to some task T and some performance measure P, if its performance on T, as measured by P, improves with experience E.
Inputs to our Problem is 3 types of wheat seeds data (as listed in UCI machine learning repository). The machine learning algorith we intend to apply is an Unsupervised Learning. The algorithm looks for structure in the training data, like finding which examples are similar to each other, and group them in clusters. such as k-means to cluster the measured samples of wheat grains. In our dataset we have 7 attributes of 3 types of wheat samples. Objective of the analysis is to find a distinct relation between the physical attributes of wheat seeds and the type of wheat.
The Dataset provided from UCI machine learning repository http://archive.ics.uci.edu/ml/datasets/seeds

Data Set Characteristics: Multivariate
-
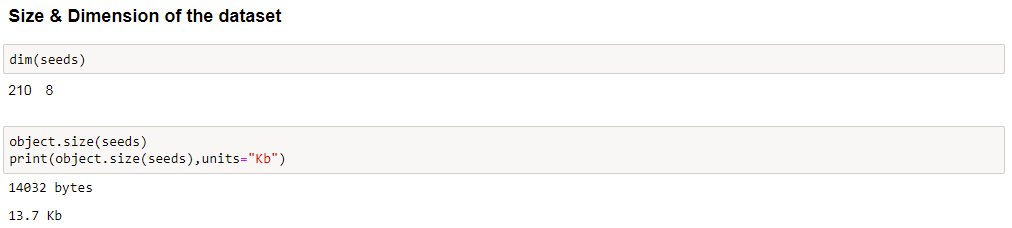
Number of Instances: 210
-
Number of Attributes: 7
-
Data Type for our dataset is Numeric (floats)
-
Dataframe Dimensions: 210 rows x 8 columns (Last column is depecits the type of wheat which is removed from cluster analysis)
The examined group comprised kernels belonging to three different varieties of wheat: Kama, Rosa and Canadian, 70 elements each, randomly selected for the experiment.
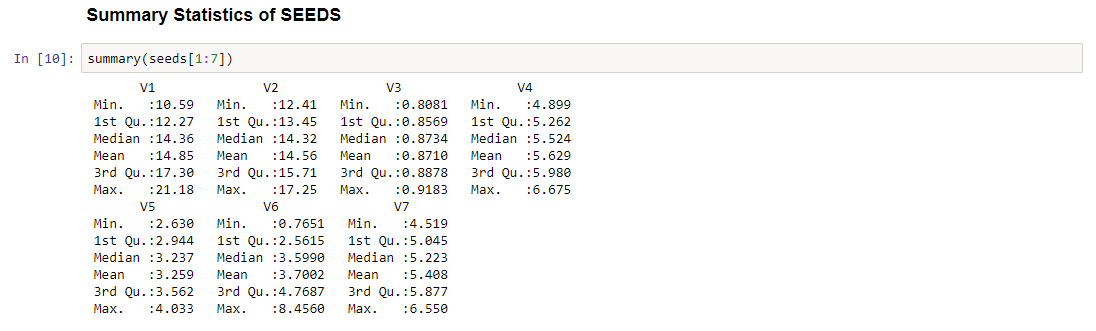
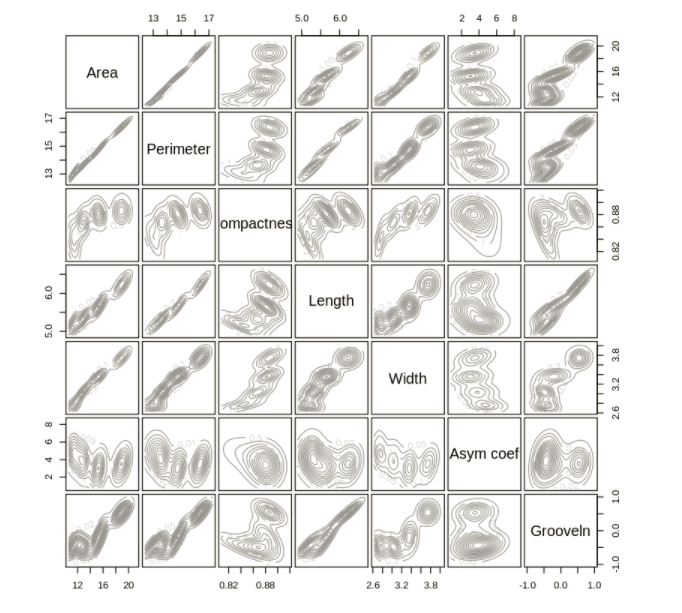
To construct the data, seven geometric parameters of wheat kernels were measured:
- area A,
- perimeter P,
- compactness C = 4piA/P^2,
- length of kernel,
- width of kernel,
- asymmetry coefficient
- length of kernel groove. All of these parameters were real-valued continuous.
High quality visualization of the internal kernel structure was detected using a soft X-ray technique. It is non-destructive and considerably cheaper than other more sophisticated imaging techniques like scanning microscopy or laser technology. The images were recorded on 13x18 cm X-ray KODAK plates. Studies were conducted using combine harvested wheat grain originating from experimental fields, explored at the Institute of Agrophysics of the Polish Academy of Sciences in Lublin.
The data set can be used for the tasks of classification and cluster analysis.
Summary statistics of the data
The proposed is to compare the K-Means Clustering machine learning algorithms and to identify if this is one the best at identifying the variety of wheat from its geometric properties.
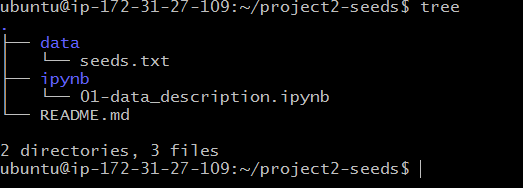
The data was downloaded from the UCI machine learning repository and loaded into Juypter for analysis.
The data was visualised and plotted in R. We use the seeds data set to demonstrate cluster analysis in R. The examined group comprised kernels belonging to three different varieties of wheat: Kama, Rosa and Canadian, 70 elements each. The visualisations show that the data does fall into a number of distinct clusters. These distributions suggest that the data should lend itself to clustering and classification.
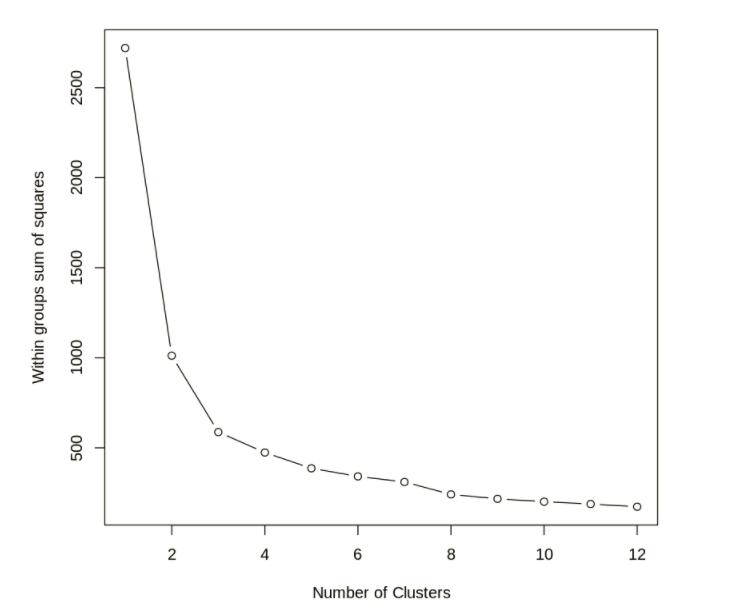
K- Means Clustering The main objective in cluster analysis is to group objects that are similar in one cluster and separate objects that are dissimilar by assigning them to different clusters. One of the most popular clustering methods is K-Means clustering algorithm. It classifies object to a pre-defined number of clusters, which is given by the user (assume K clusters). The idea is to choose random cluster centres, one for each cluster. These centres are preferred to be as far as possible from each other. K-Means clustering is a process whereby n observations are assigned to one of K clusters based on the distance to the mean of the cluster. The clustering process is initialised by random selection of points from the data set. The nearest distance is derived by the within cluster sum of squares. The K-Means clustering algorithm used for the analysis was loaded from the NbClust library. The data was prepared by scaling so that all of the attributes fall within a similar range of values. The scaled data is then passed through the K-Means clustering algorithm to find the optimum number of clusters. A plot of the within groups sum of squares was produced suggesting that the optimum number of clusters was three.
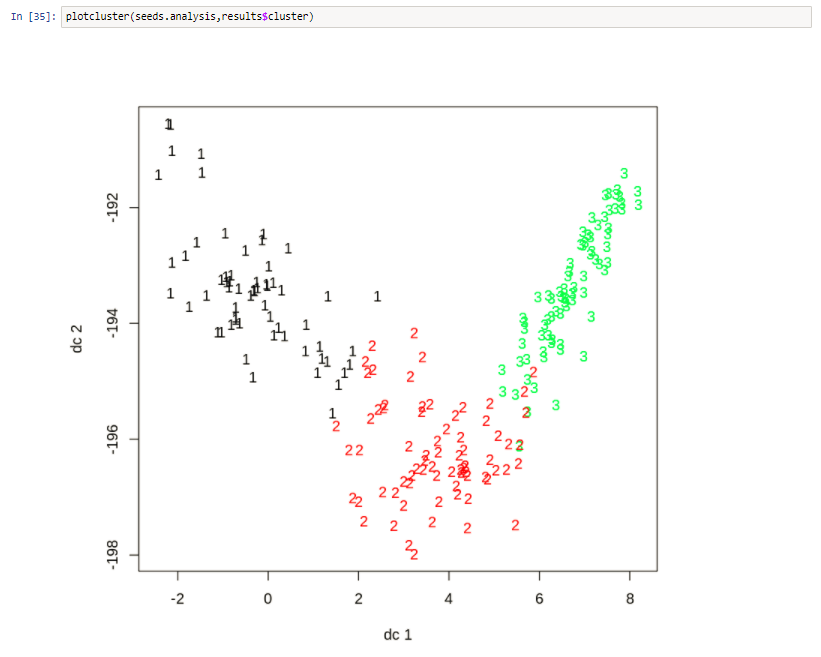
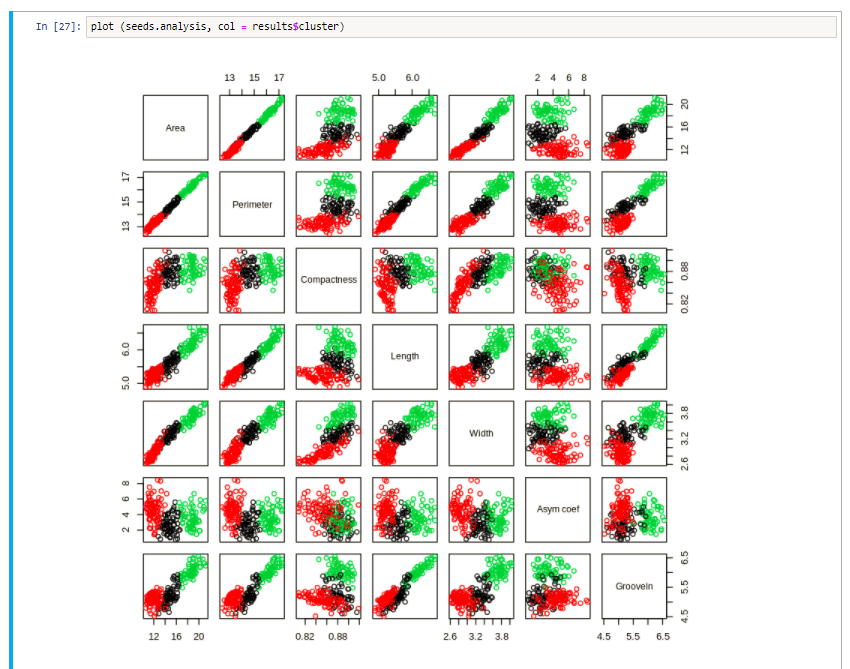
The K-Means was able to successfully identify three naturally occurring classes without using the label attribute. This fits with the label attribute and what we know about the data. The K-Means algorithm successfully picked out 3 clusters without using the target attribute. When the target attribute is compared to the predictive cluster it can be seen that the clustering process is very good.
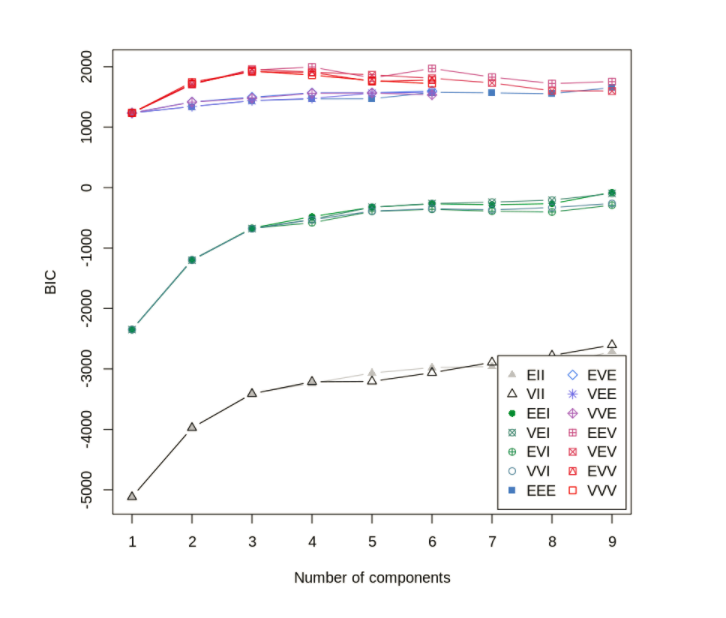
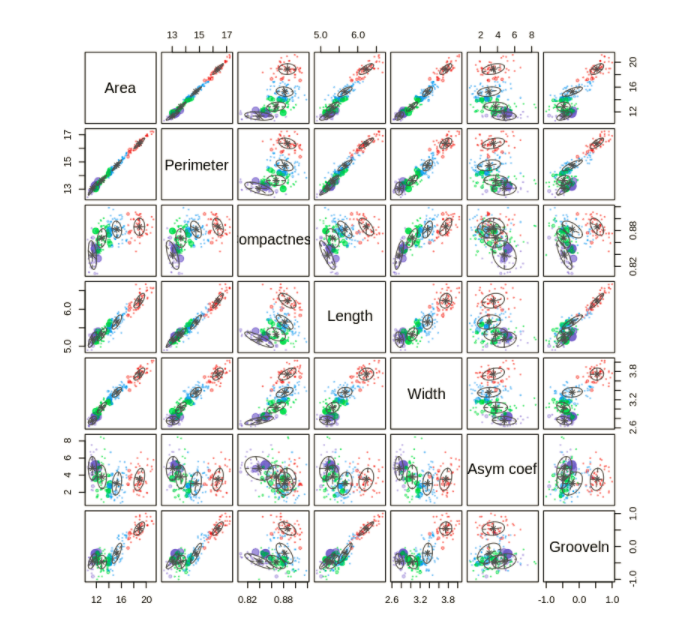
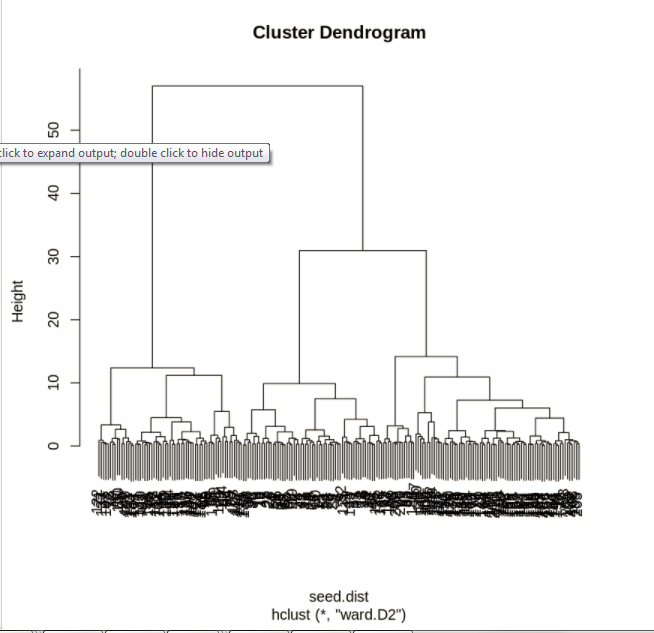
Model based Cluster Analysis - Gaussian Mixture Model Few more option for cluster Analysis are Gaussian Mixture Model, Cluster Dendrogram
n/a Clustering generally does not have a benchmark model since we have no targets.
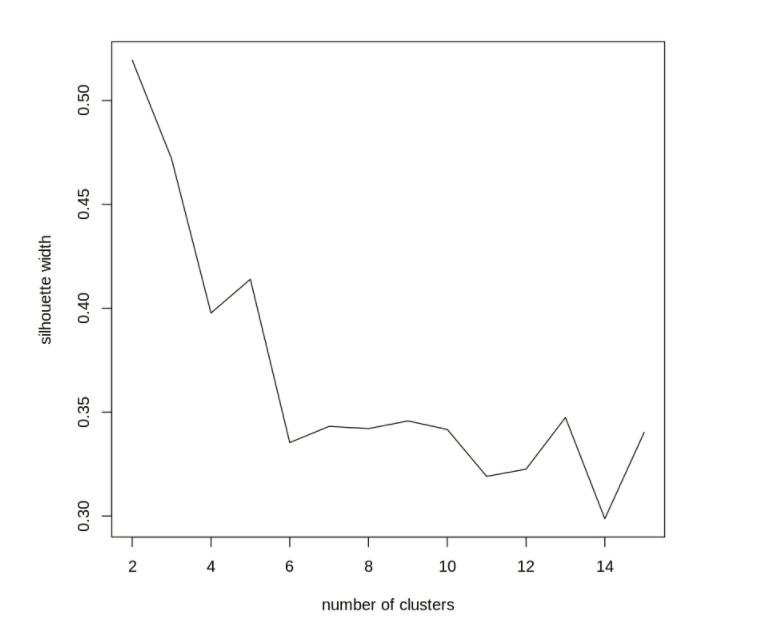
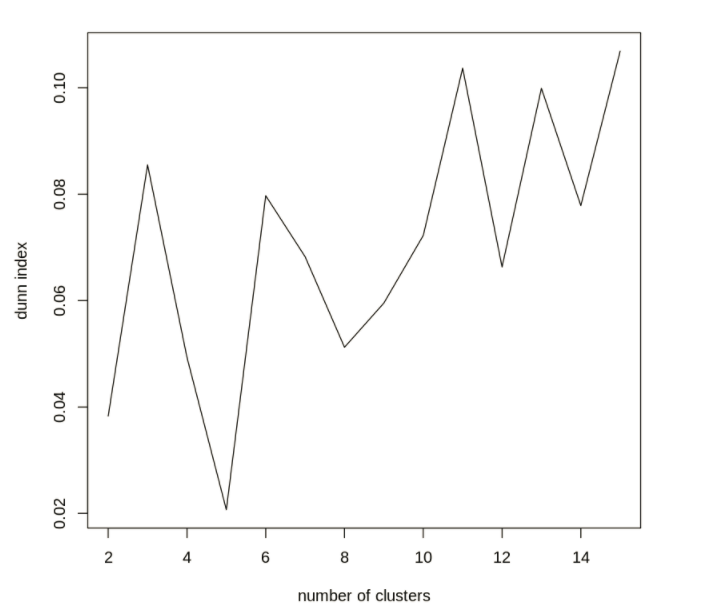
Given that this is a clustering task, we can measure the success of our model using Silhouette Score or Dunn Index
K-Means algorithms performed very well on this data set and were able to identify the variety of wheat by the geometric properties of the seed kernels. The K-Means was able to successfully identify three naturally occurring classes without using the label attribute. This fits with the label attribute and what we know about the data.
This experiment also shows that it would be possible to use the K-Means algorithm to generate a set of classes from data that doesn’t have a classification label attribute.