The 700 sized dataset : It seems the weight column has become corrupted. For some data points the eight and height have simply been set to be equal and for other the weight is much too low. An 11 year old will not weigh 5.05 kg for instance. If you plot height vs weight you'll see immediately that apart form the line of data-points where height and weight coincides there seems to be no correlation which is highly suspect. link : https://www.kaggle.com/datasets/sulaimanahmed/lung-capacity-data/data
Used kaggle to find other dataset with about 470 data-points, could not find any with name "tidal volume" so I switched to find one with Total Lung Capacity as they both are generally in some fixed proportion so the study on total lung capacity should give same prediction as with Tidal Volume. link: https://www.kaggle.com/datasets/klu2000030172/lung-disease-dataset
Finally I found a trustable dataset. But accessing the lung volume from the text file was quiet tiresom. link: https://www.ncbi.nlm.nih.gov/pmc/articles/PMC9168312/. The text file had rate to air flow
Finally used the second dataset.
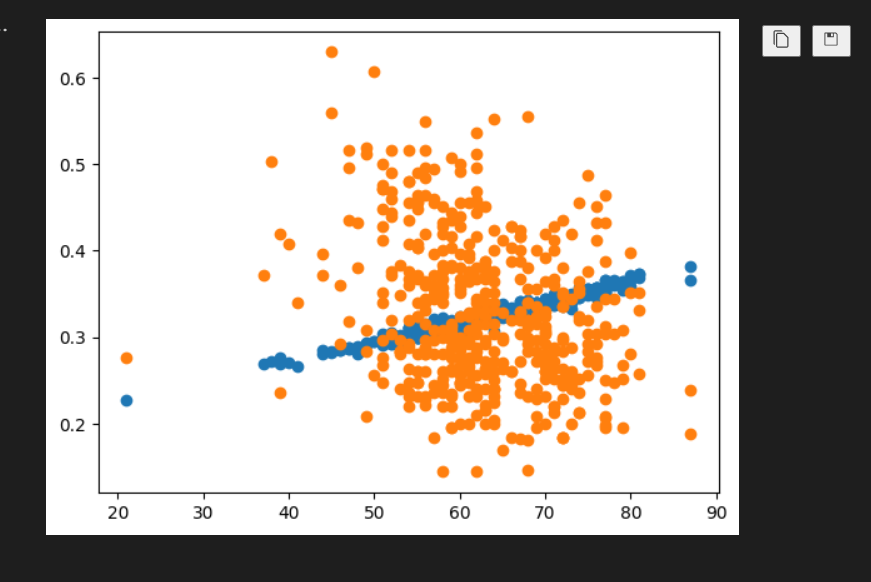
- Tried Linear Regression: Got very high error, this means that lung capacity is not a linear function of other parameters.
(Yellow points show actual values and blue shows perdicted values)
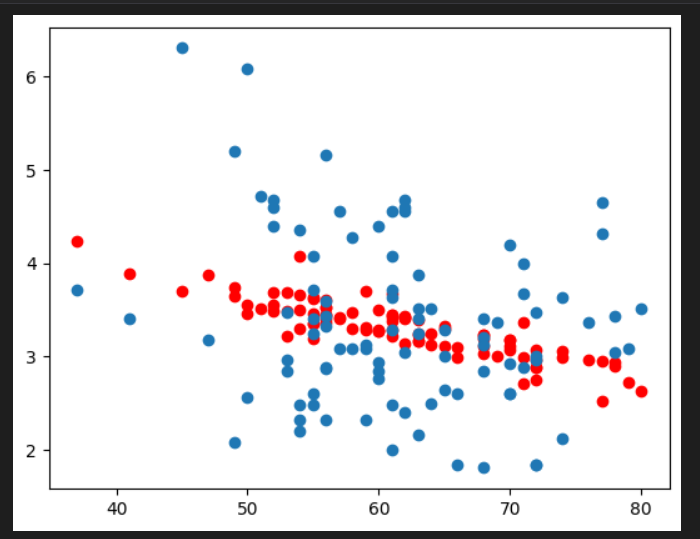
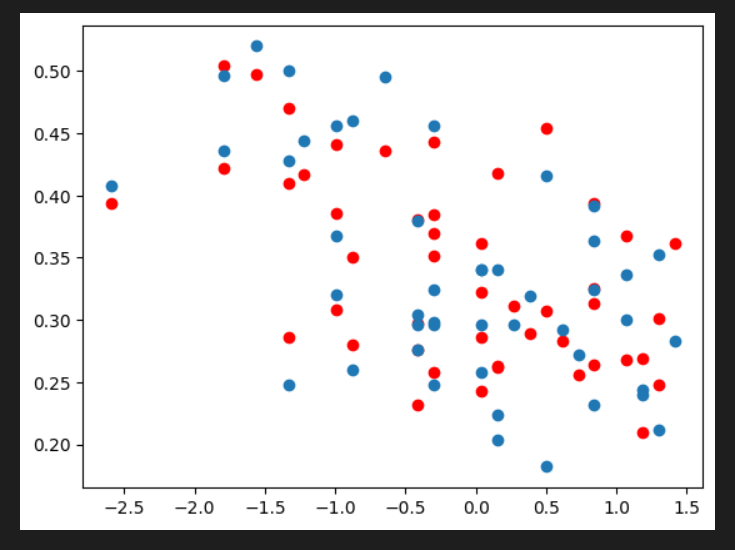
(Blue points show actual values and red shows perdicted values)
- Tried other ways but those also didn't work well.
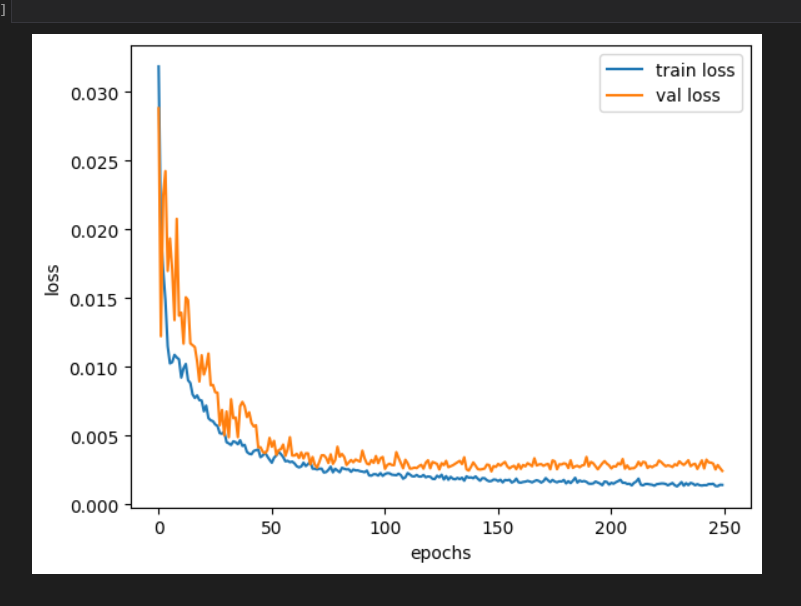
- USED NEURAL NETWORKS FOR REGRESSION
- Increasing number of neurons in a dense layer was morw helpful than increasing number of hidden layers.
- Tried various combinations and found the best one to be with three dense layers, one input layer and one output layer.
- Added some dropout layers to prevent overfitting.
- Used StandardScaler to normalize the data which increases model's speed and accuracy.
- Used ADAM optimizer.
- The model is taking about 20 seconds to train.
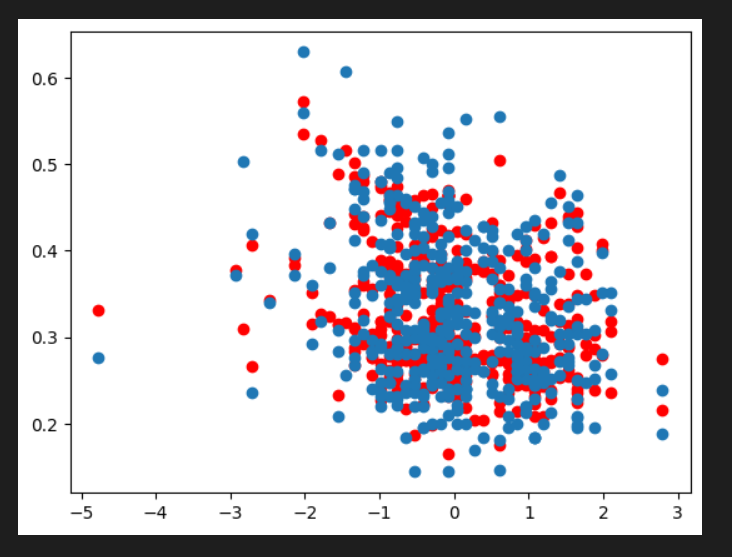
(Blue points show actual values and red shows perdicted values)
(Blue points show actual values and red shows perdicted values)
- Download all the files in the repository.
- To again train the model, run all the cells.
- A pre-trained model is already saved, to use this model load the model.
- Provide the required attributes in the form of csv file that are [FEC1, AGE, SMOKE(
$1$ for$yes$ ,$0$ for$no$ ), O2($0$ or$1$ ), ABG-P-O2 ($0$ or$1$ ) , ABG-P-CO2($0$ or$1$ ), ABG-pH-Level($0$ or$1$ ), Asthama($1$ for$yes$ $0$ for$no$ ), Other Diseases($1$ for$yes$ $0$ for$no$ ), PEFR($0$ or$1$ ), Risk($0$ or$1$ )]. These must be in the specific order give above. - You will get the output which is the Lung Tidal Volume in Liters.