





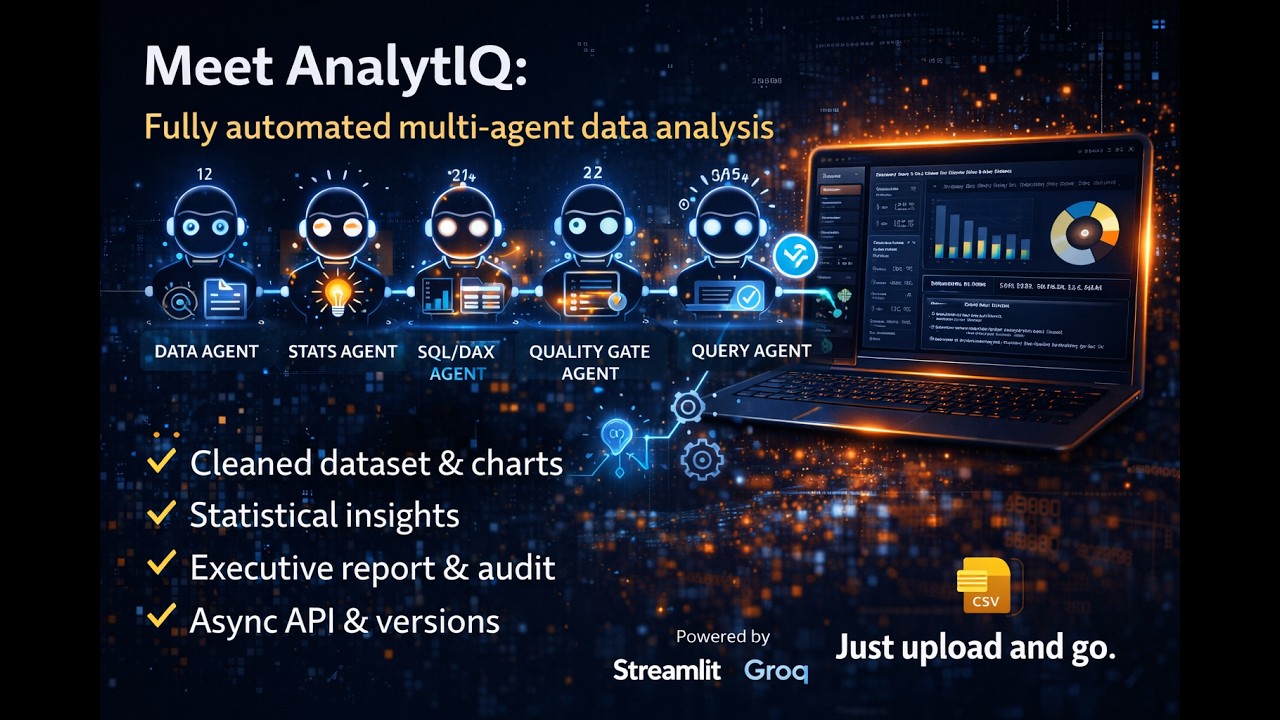
💡 Tip: For the best experience, watch this demo in 720p HD — click the gear icon ⚙️ on YouTube and select Quality → 720p.


- What is AnalytIQ?
- System Architecture
- Agent Pipeline
- Features
- Quick Start
- API Endpoints
- Evaluation & Benchmark
- Project Structure
- Demo Datasets
- Navigation Flow
- API Keys
- What's Coming Next
- Requirements
- Contributing
- License
- Author
AnalytIQ is a fully automated, multi-agent data analysis platform built with Streamlit and powered by Groq's LLaMA 3.3 70B.
You upload a file — the platform does the rest.
A crew of five specialized AI agents fire in sequence, each passing a shared memory block to the next. By the time the Quality Gate agent finishes, you have:
- ✅ A cleaned & profiled dataset
- ✅ Statistical insights and patterns
- ✅ Auto-generated interactive charts
- ✅ A domain-framed executive report
- ✅ A quality audit score with verdict
- ✅ An SQL/DAX query optimizer (Groq-powered)
- ✅ Full vs Lightning mode benchmarking and leaderboard scores
- ✅ Async API jobs for long-running analysis
- ✅ Versioned run artifacts for reproducibility
No data science experience required. No complex setup. Just upload and go.
╔══════════════════════════════════════════════════════════════════╗
║                    AnalytIQ  v9.0                                ║
║               Streamlit Dark-Mode Web Application                ║
╚══════════════════════╦═══════════════════════════════════════════╝
                       ║
       ╔═══════════════╬══════════════════════╗
       ▼               ▼                      ▼
┌─────────────┐  ┌─────────────────┐  ┌──────────────────────┐
│  Data Layer │  │  Agent Layer    │  │     Query Lab        │
│             │  │  (Groq LLaMA)   │  │    (Groq LLaMA)      │
│ · DataProc  │  │                 │  │                      │
│   load CSV/ │  │  ① Data Eng.   │  │  · SQL Optimizer     │
│   Excel     │  │        ↓        │  │  · DAX Optimizer     │
│   clean     │  │  ② Analyst     │  │  · Auto-Generate     │
│   profile   │  │        ↓        │  │    from schema       │
│   stats     │  │  ③ Visualizer  │  └──────────────────────┘
│             │  │        ↓        │
│ · DataViz   │  │  ④ Reporter    │
│   8 charts  │  │        ↓        │
│   builder   │  │  ⑤ Quality Gate│
└─────────────┘  └────────┬────────┘
                          │  memory-linked pipeline
                          ▼
             ┌────────────────────────┐
             │      Output Layer      │
             │  · Analysis insights   │
             │  · Executive report    │
             │  · QG verdict + score  │
             │  · Agent memory log    │
             │  · Plotly charts       │
             │  · JSON / TXT export   │
             └────────────────────────┘
CSV / Excel  (or built-in demo dataset)
    │
    ├──▶  utils/data_processor.py   ──▶  cleaned DataFrame + text profile
    ├──▶  agents/crew_agents.py     ──▶  5-agent Groq pipeline
    │          Agent ① → ② → ③ → ④ → ⑤ Quality Gate
    ├──▶  utils/visualizer.py       ──▶  Plotly interactive figures
    └──▶  app.py  (Streamlit)       ──▶  rendered UI + download exports
Five agents run in strict sequence. Each receives the full output of all prior agents via a shared memory block — enabling chained, context-aware reasoning.
| # | Agent | Role |
|---|---|---|
| ⬡ 1 | Data Engineer | Validates, cleans nulls, detects types, writes data profile |
| ◎ 2 | Data Analyst | Statistical analysis — patterns, correlations, outliers, anomalies |
| △ 3 | Visualizer | Generates Python/Plotly chart code and recommendations |
| ▫ 4 | Report Writer | Domain-framed executive report with key findings |
| 🛡 5 | Quality Gate | Audits every claim · issues PASS / WARN / FAIL verdict + score |
Domain contexts: Finance · HR · Marketing · Healthcare · General
Each domain tunes every agent's system prompt for field-specific vocabulary, priority metrics, and framing.
| Module | Details |
|---|---|
| 📂 Upload | CSV / Excel · auto-detect types · instant preview · session state |
| 🔍 Profile | Column stats · null analysis · type breakdown · distributions |
| 📊 Analytics | Correlation matrix · segmentation · distribution · summary stats |
| 📈 Visualization | 8 chart types · Chart Builder · Auto-Generate · Gallery |
| 🤖 AI Engine | 5-agent Groq pipeline · domain selector · memory log · QG verdict |
| ⚡ Lightning Mode | Faster run mode for low-latency analysis workflows |
| 🧪 Evaluation Lab | Full vs Lightning benchmarking with composite score leaderboard |
| 🧵 Async Jobs API | Submit analysis jobs, poll status, fetch final result |
| 📡 Metrics API | Run completion rate, verdict distribution, and latency summaries |
| 🔬 Query Lab | SQL optimizer · DAX optimizer · auto-generate queries (Groq) |
| 💾 Export | .txt report · .json full export · audit .md · pipeline download |
| 🎮 Demo Data | HR Analytics · E-commerce · Finance Report (built-in, no upload needed) |
- Dark-mode only — deep
#0d0f14background with glassmorphism cards - Inter + JetBrains Mono typography
- Purple
#7c6affaccent · Cyan#38bdf8secondary - Page-transition flash animations on every navigation
- Dot-bounce animated processing spinners
- Ripple effects on nav buttons
- Glowing animated progress bar during AI pipeline
git clone https://github.com/Yashaswini-V21/Multi-Agent-Analysts.git
cd Multi-Agent-Analysts
pip install -r requirements.txtCreate local env from template:
copy .env.example .envThen edit .env:
# Required — AI Engine + Query Lab
GROQ_API_KEY=gsk_...        # https://console.groq.com  (free)

# Optional — model override
GROQ_MODEL=llama-3.3-70b-versatile

# Optional — API protection
API_AUTH_ENABLED=false
API_AUTH_KEY=replace_with_strong_key

# Optional — key rotation audit
KEY_ROTATED_AT=YYYY-MM-DDTHH:MM:SS+00:00
No API key? Upload → Profile → Analytics → Visualization all work without any key.
python -m streamlit run app.pyOpen http://localhost:8501 in your browser.
python -m uvicorn api.server:app --host 0.0.0.0 --port 8000 --reloadOpen http://localhost:8000/docs for API docs.
docker compose up --buildGET /healthGET /health/keysPOST /analyzePOST /evaluatePOST /jobs/analyzeGET /jobs/{job_id}GET /jobs/{job_id}/resultGET /metrics/summary
If API auth is enabled, pass:
X-API-Key: <your_api_auth_key>
Run mode comparison (Full vs Lightning):
python main.py evaluate sample_data.csv --domain General --repeats 2 --modes full lightningGenerate benchmark evidence file:
python scripts/generate_benchmark_report.py --repeats 2 --modes full lightningMulti-Agent-Analysts/
│
├── app.py # Streamlit app (~2800 lines)
│ # · CSS design system (Inter + JetBrains Mono)
│ # · All 7 page functions
│ # · Sidebar + navigation
│ # · Query Lab (Groq-powered)
│ # · Animation helpers
│
├── agents/
│ ├── crew_agents.py # 5 GroqAgent classes + DataAnalysisCrew
│ └── prompts.py # System prompts & DOMAIN_CONTEXTS
│
├── api/
│ └── server.py # FastAPI endpoints
│
├── services/
│ ├── analysis_service.py # Analysis orchestration
│ ├── evaluation_service.py# Evaluation and scoring
│ ├── job_service.py # Async job queue and polling
│ ├── metrics_service.py # Metrics summary generation
│ └── benchmark_service.py # Benchmark report generation
│
├── utils/
│ ├── data_processor.py # DataProcessor — load, clean, profile
│ ├── visualizer.py # DataVisualizer — auto chart generation
│ ├── config.py # Environment config
│ ├── telemetry.py # Step timing telemetry
│ ├── artifacts.py # Artifact persistence
│ ├── reproducibility.py # Dataset fingerprint/schema snapshot
│ └── security.py # Key rotation status checks
│
├── tests/ # Unit tests (API, pipeline, evaluation, security)
├── scripts/
│ └── generate_benchmark_report.py
│
├── outputs/
│ ├── charts/ # Saved chart exports
│ ├── data/ # Processed data exports
│ └── reports/ # Generated report files
│
├── sample_data.csv # Small sample dataset
├── requirements.txt # Python dependencies
└── .env # API keys ← gitignored
Three built-in datasets — no file upload needed. Click "Load Demo" on the Upload page.
| Dataset | Rows | Domain | Key Columns |
|---|---|---|---|
| 👥 HR Analytics | 200 | HR | Dept, Level, Age, Salary, Performance, Attrition |
| 🛒 E-commerce Sales | 200 | Marketing | Category, Region, Revenue, Status, Rating |
| 📈 Finance Report | 96 | Finance | Month, Revenue, COGS, GrossProfit, EBITDA |
① Overview  →  ② Upload  →  ③ Profile  →  ④ Analytics
                                                  ↓
          ⑦ Query Lab  ←  ⑥ AI Engine  ←  ⑤ Visualize
- Every page has ← Back and Forward → buttons at the bottom
- Sidebar radio always reflects the current page and stays stable during widget interactions
- Smooth slide-in animation on every page transition
| Key | Used For | Get it Free |
|---|---|---|
GROQ_API_KEY |
AI Engine (5-agent pipeline) + Query Lab | console.groq.com |
API_AUTH_KEY |
Optional protection for backend endpoints | Set locally in .env |
These features are actively planned and will ship in upcoming releases. ⭐ Star & watch the repo to get notified!
| Feature | Description |
|---|---|
| ☁️ Streamlit Cloud Deploy | One-click public deployment — try without any local setup |
| 📊 PowerBI Export | Push charts and auto-generated DAX directly into Power BI |
| 🗣 Voice-to-Query | Speak your data question — get SQL back instantly |
| 📋 Multi-file Join | Upload two CSVs and auto-merge on matching columns |
| 📧 Email Delivery | Send the full analysis report straight to your inbox |
| Feature | Description |
|---|---|
| 🤝 Real-time Collaboration | Share a session URL — multiple analysts, one dataset |
| 🗄 Database Connector | Connect PostgreSQL / MySQL / BigQuery directly |
| 📱 Mobile Layout | Full responsive design for phone & tablet |
| 🔄 Scheduled Pipelines | Run analysis automatically on a cron schedule |
| 🧩 Plugin SDK | Build and plug in your own custom agent |
| Upgrade | Details |
|---|---|
| 💬 Agentic Chat | Ask follow-up questions about your data in natural language |
| 🔍 Anomaly Detection Agent | Dedicated ML-based outlier flagging with explanations |
| 📅 Forecasting Agent | Time-series prediction with confidence intervals |
| 🌍 Multi-language Reports | Generate analysis reports in 10+ languages |
| 🤖 Model Selection | Choose between Groq, GPT-4o, Claude 3.5 in settings |
streamlit       pandas          numpy
plotly          python-dotenv   groq
openpyxl        scipy
Full pinned versions in requirements.txt.
Contributions are very welcome!
# 1. Fork the repo on GitHub
# 2. Create your feature branch
git checkout -b feat/your-feature

# 3. Commit your changes
git commit -m "feat: add your feature"

# 4. Push and open a Pull Request
git push origin feat/your-feature
Please open an Issue first for large changes so we can discuss the approach.
MIT — free to use, modify, and distribute.
Yashaswini V · @Yashaswini-V21
If AnalytIQ saved you time or impressed you — please give it a ⭐
Five AI agents. One upload. Infinite insights.