Home
YABench is a benchmarking framework for RDF Stream Processing engines, such as C-SPARQL and CQELS.
First of all, you need to make sure that the following prerequisites are installed on your system:
- Java SE 8 or higher,
- Python 3 with the psutil module.
Then you're ready to download the .zip file from the latest release and unzip it.
That's it. The framework is ready to stress the engines! :)
To improve readability of the benchmarking results we built a small web application which you can run locally or use the version published online. The results are recorded in the results folder in the same folder where config.json is located.
After you run a test suite, the corresponding results folder will (among others) contain the following two files:
-
ORACLE_<testname>which contains the oracle results with precision/recall metrics, etc. -
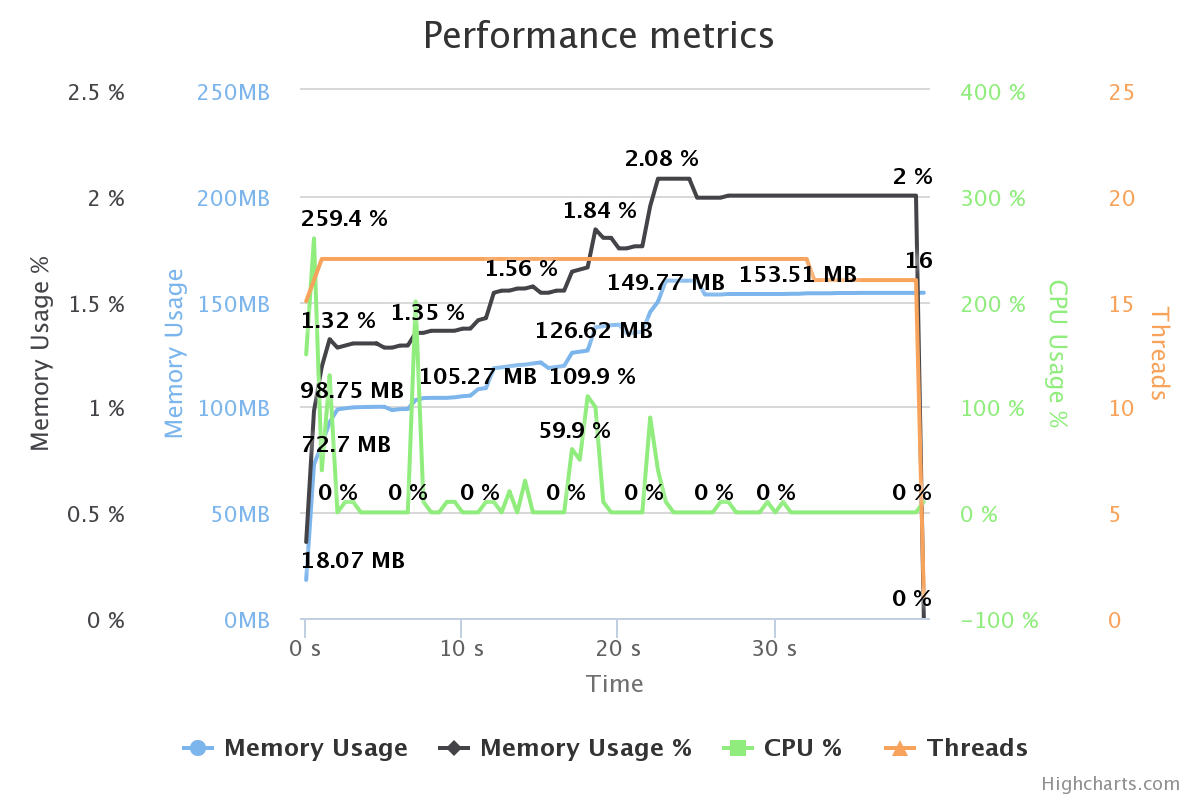
P_<testname>which contains performance metrics (memory consumption, cpu usage, etc.) -
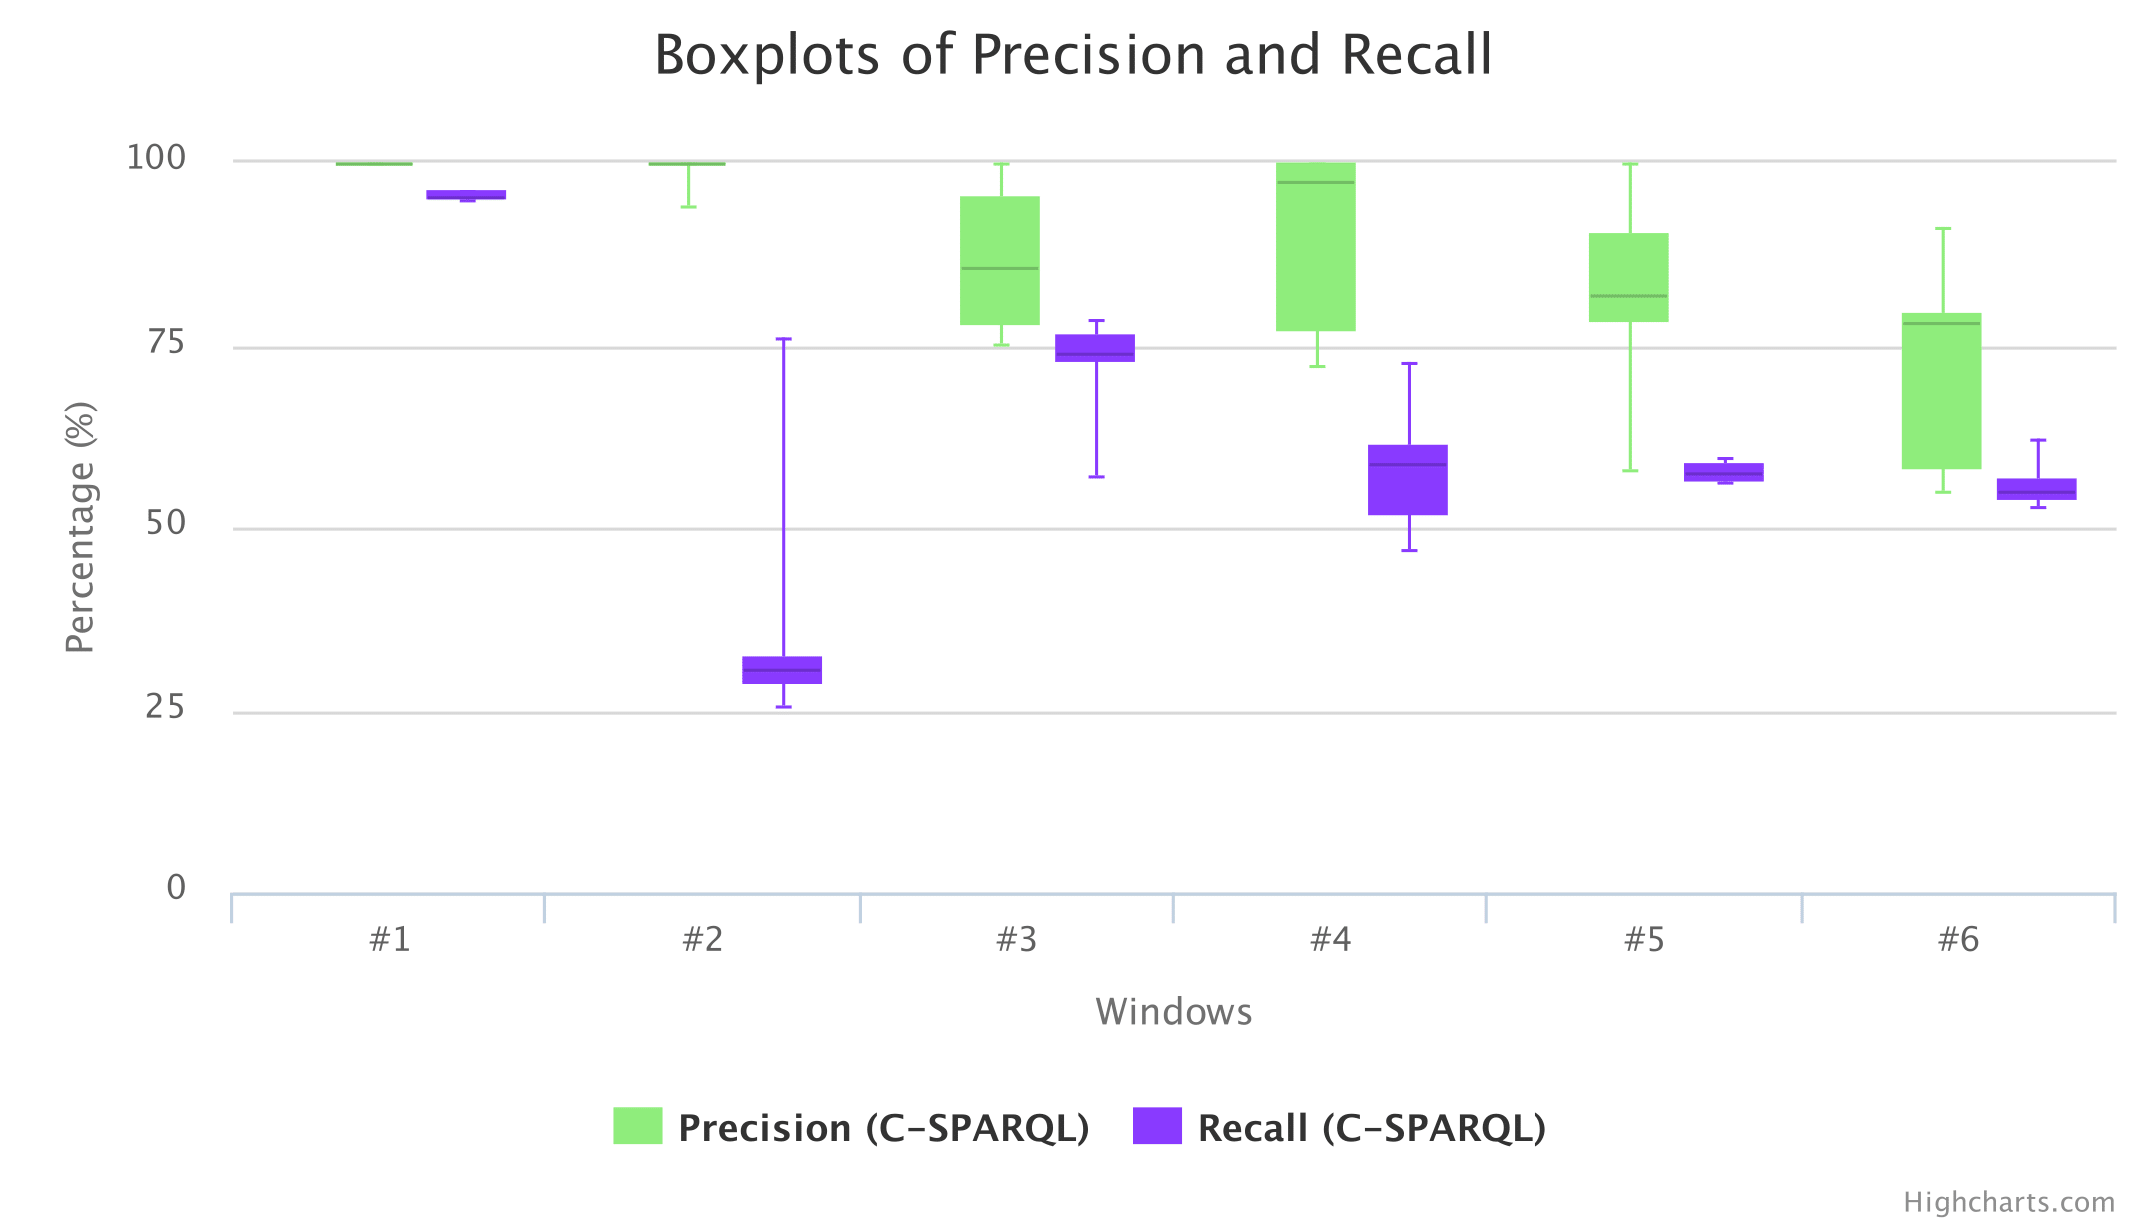
BOXPLOTS_<testname>which contains boxplots for precision, recall, and delay measurements. This file is only created if the boxplots parameter in the config file is set to true and if runs is greater than one.
To run the web application locally, you need to open index.html from the yabench-reports folder with your favourite browser (tested on Firefox). And load these two files via the Browse buttons at the top-left corner.
An example of the chart with precision and recall boxplots per window aggregating the results of ten test runs:
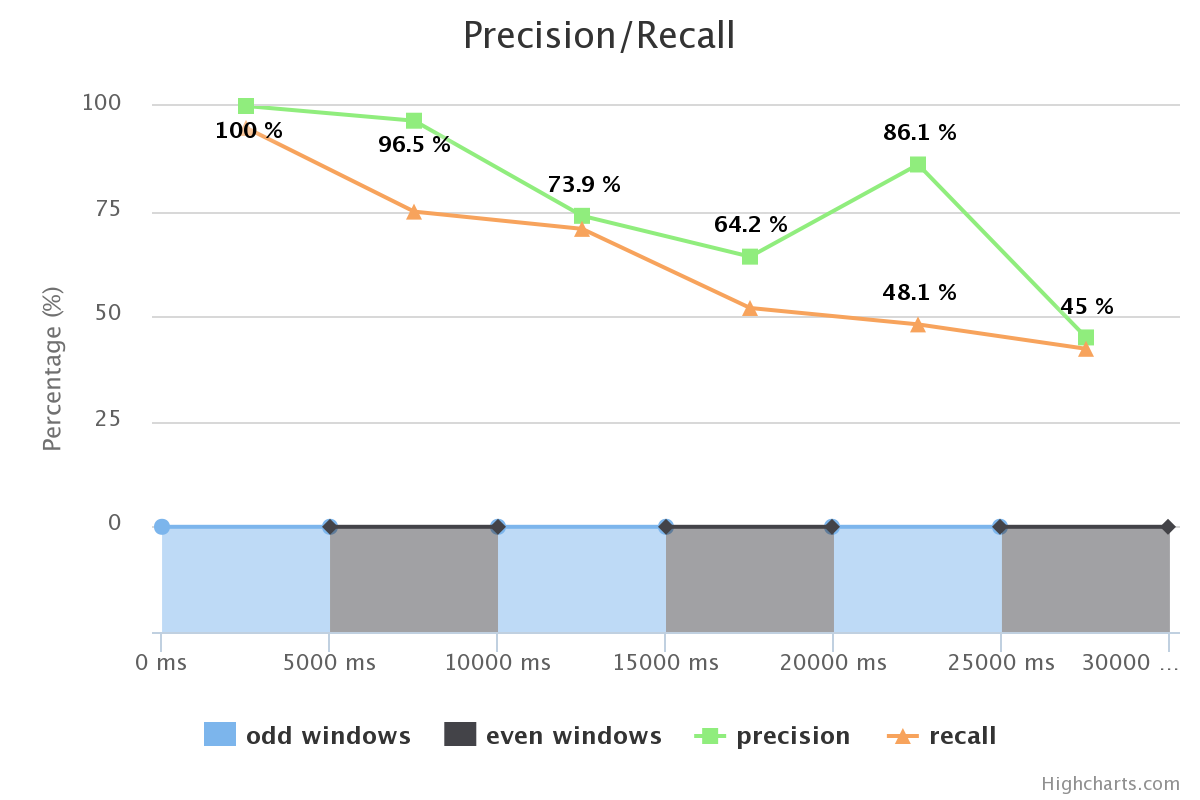
An example of the chart with precision and recall values per window, borders of the ideal windows calculated by the oracle:
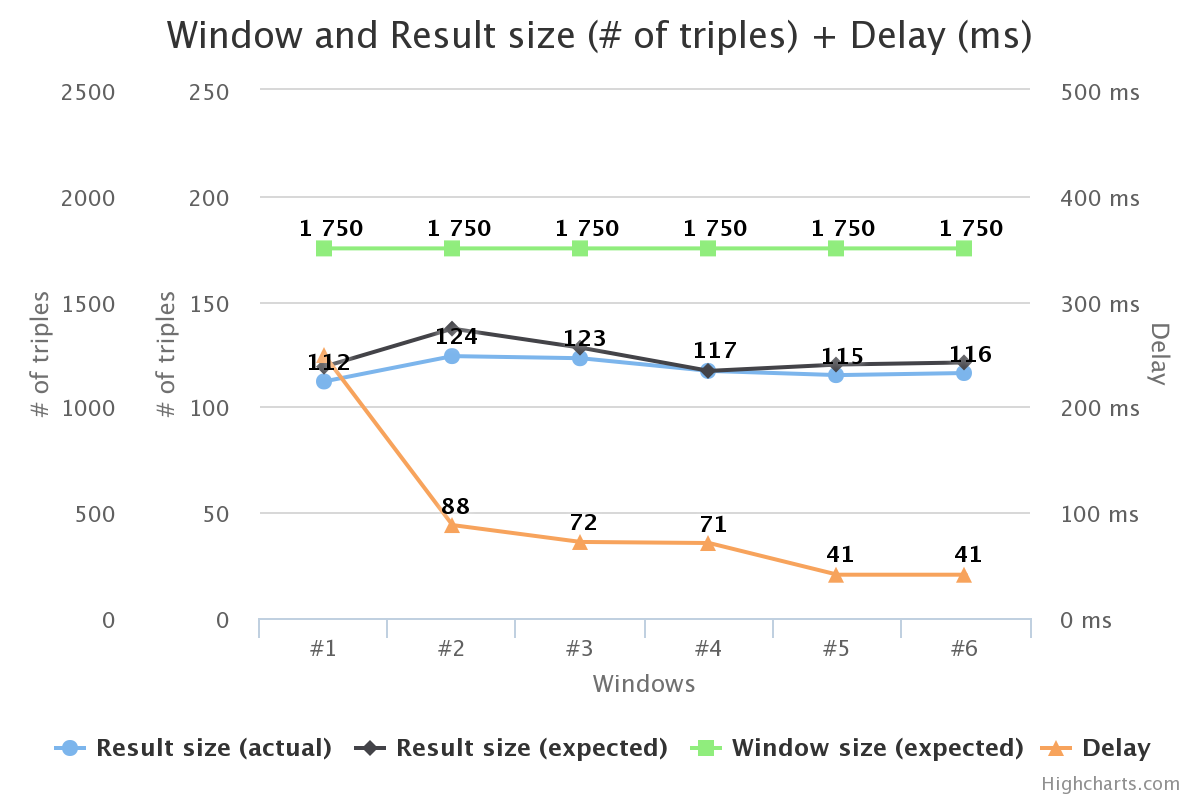
An example of the chart with the window and result size, and delay per window:
An example of the chart with the performance metrics, such as CPU, Memory, Threads:
Also the application allows you to export the charts in several formats such as PNG, SVG, PDF, etc. More you can print each individual chart directly from the application.