We read every piece of feedback, and take your input very seriously.
To see all available qualifiers, see our documentation.
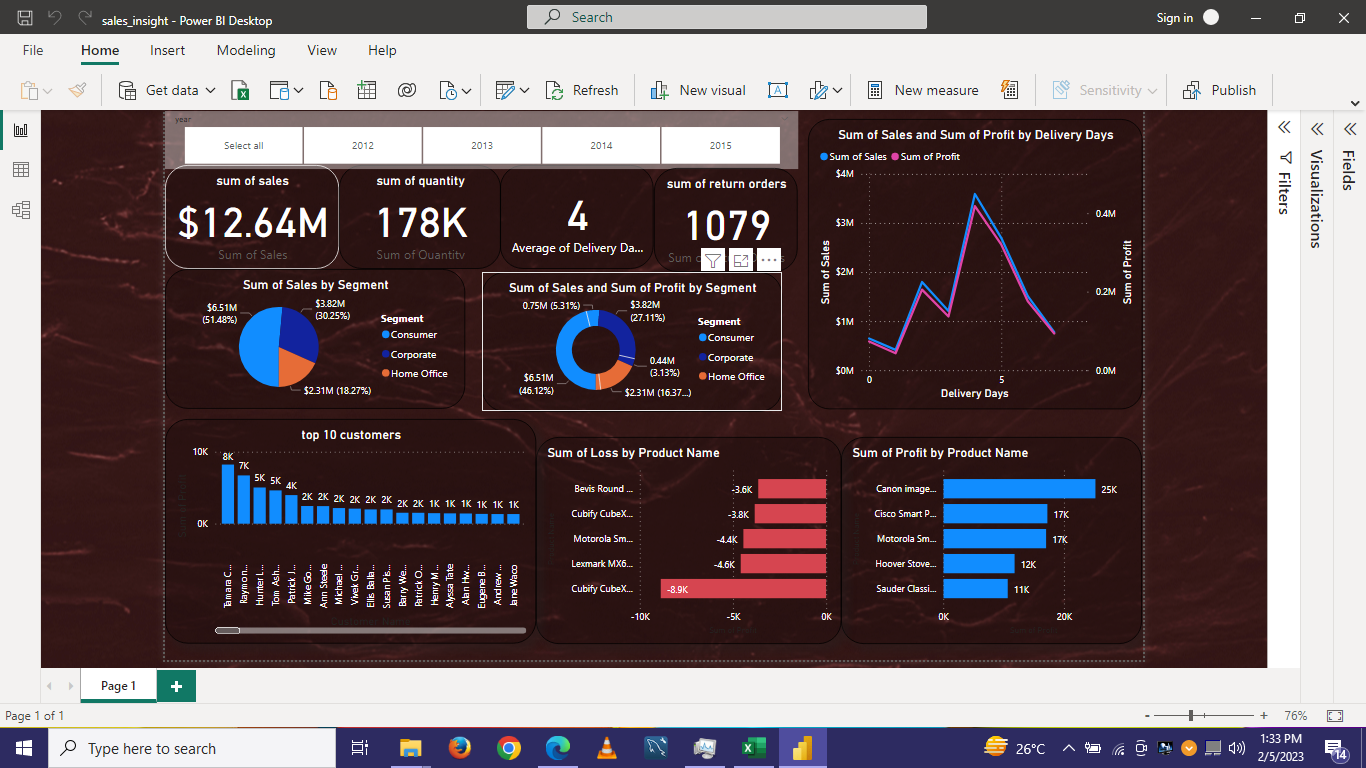
Useing Power BI to visualize the sales, profit and product market in a Dashboard
In this project the mail tools is used Power BI to visualize the sales, profit and product market in a Dashboard
There was an error while loading. Please reload this page.