Releases: MacRimi/ProxMenux
v1.2.2.1-beta
 ProxMenux v1.2.2.1-beta
Version label bumped to v1.2.2.1-beta across the UI
AppImage/package.json, the release-notes modal constant, and the three hardcoded version strings in the UI (login footer, dashboard footer, and storage-report footer) all now read v1.2.2.1-beta. The release-notes modal's CURRENT_VERSION_FEATURES array was also rewritten to advertise this beta's three highlights (header Critical fix, auto-reconcile, and Send Test consistency) instead of carrying over the v1.2.2 stable list.
Fix — Coral PCIe (gasket-dkms) driver: false-positive "update available" notification after re-install
Issue: The Coral TPU driver update — v1.0-18.x notification kept firing every cycle, even immediately after running the installer.
Root cause: install_coral.sh uses dkms install gasket/1.0 from a Git clone of feranick/gasket-driver, so the version registered with DKMS is always the bare upstream 1.0 (no patch level). managed_installs._detect_coral_host fell back to dkms status (since the script doesn't ship a .deb, so dpkg-query gasket-dkms returns nothing), read 1.0, and the update comparator's "no -N segment ranks as 0" rule made any feranick tag (1.0-18.x) look newer.
Fix: install_coral.sh now resolves the latest feranick release tag via the GitHub API right after the DKMS install succeeds and writes it to /var/lib/proxmenux/coral_gasket_version. The full uninstall path removes the marker so a clean wipe leaves no stale signal. _detect_coral_host now reads that marker first as the authoritative installed version; the existing dpkg / dkms fallbacks remain in place for installations that pre-date this change.
Existing installations need to re-run the installer once for the marker to land — or, as a one-off recovery, write the current feranick tag manually to that path. The detector treats both as equivalent.
Fix #226 — Notification "Send Test" buttons: consistent position and channel color
Every notification channel's Send Test button now sits on the left side of the form and is tinted with the channel's brand color, matching the active-tab text. Telegram is blue, Gotify green, Discord indigo, Email amber, and Apprise cyan — all with white text. Previously, the Apprise button was right-aligned and the only one in color, while the other four were left-aligned and neutral. The fix unifies all five buttons to the same wrapper layout and applies channel-specific brand colors across the row.
Fix #228 — Header "Critical" badge respected user dismissals
Issue: When permanently dismissing every CRITICAL alert in a category, the popup at the bottom of the page correctly displayed "0 Critical" while the badge in the top right kept showing Critical.
Root cause: Every _check_* in the health monitor was already pushing its raw status into the critical_issues, warning_issues, and info_issues lists before the existing dismiss-aware merge ran, so the global overall status was computed off a pre-filter view. The popup compensated for this on the client side, which caused the two surfaces to disagree.
Fix: The rollup now runs a final pass — _apply_dismiss_aware_status — over details[<category>] after the checks complete, demotes a block to OK when every underlying error_key is acknowledged (annotating dismissed/permanent markers per entry), and rebuilds the issue lists from those post-filter statuses. The badge, the popup, future notifications, and any external API consumer of /api/system-info now see the same dismiss-aware view. The change is symmetric: a CRITICAL alert that has not been dismissed still pushes the badge to Critical exactly as before.
Health Monitor auto-reconcile — PVE storage removed, orphan remote mounts, deleted CT mounts
_cleanup_stale_resources (the periodic resolver that auto-clears errors for resources that no longer exist) gained three new cases that previously left alerts pinned forever:
- PVE storage removed from
pvesm. Errors keyedstorage_unavailable_<id>andpve_storage_full_<id>now resolve automatically when the matching storage no longer appears inpvesm status. The check is gated onpvesmactually returning a non-empty list, so a momentary timeout doesn't wrongly clear genuine errors. - Orphan remote mounts.
mount_<status>_<target>errors resolve when the target is no longer present in/proc/mountsas an NFS/CIFS/SMB entry. LXC-scoped entries (ct123:/mnt/foo) are deliberately left to the existing VM/CT cleanup path so the host-side reconciler doesn't poke around inside a stopped container. - LXC mount errors when the CT was deleted.
lxc_mount_<vmid>_<mount>errors resolve when the matching VMID is no longer reported byqm/pct config. The existing VM/CT block was matching onvm_/ct_/vmct_prefixes only, so the LXC-mount-capacity check fell through that filter and its alerts persisted across CT deletion.
Dashboard restyle — Overview / Storage / Network / VMs & LXCs header cards
The four header cards at the top of each main tab were rebuilt to reduce the visual fatigue of the original Card + Progress block pattern and to align them with the rest of the Monitor's design language. The data they expose is unchanged; the interface surface is.
The usage cards (CPU Usage, Memory, Local Used, Remote Used, Total CPU Allocated, and Total Memory) pair a 72 px SVG donut on the left with two mini-rows on the right — each row a label/value pair stacked over a 1.5 px progress bar. The trailing summary row (Cores, Total, etc.) sits flush below the last bar without a separator. The count cards (Active VM & LXC on Overview, Total VMs & LXCs on the VM tab) use a single 4xl headline with a running badge on the right, then secondary pills (9 VMs, 4 LXC, 10 stopped) underneath. Network Traffic shows ↓ Down / ↑ Up headlines with a two-segment proportional bar and a Down % / Up % legend. Network Status moved from a stacked-label grid to inline Label: value rows so Hostname, DNS, Errors, and Domain each fit on one line. Total Storage computes total capacity from totalLocalCapacity + totalRemoteCapacity (formatted through the existing formatStorage) instead of the previous storageData.total which read independently of the bar's breakdown; the Local / Remote / Free legend stacks vertically so values never wrap.
Total CPU Allocated drops the host-thread row — that information is now in the Overview's CPU Usage card as Cores 8/16 (physical / logical, surfaced through cpu_count(logical=False) and cpu_count(logical=True)) — and exposes the two guest-side numbers operators actually want: Configured (sum of maxcpu across every VM/LXC) and In use (same sum restricted to status === "running"). maxcpu was added to the /api/vms payload from pvesh /cluster/resources.
All four grids collapse to a single column under 640 px (grid-cols-1 sm:grid-cols-2 lg:grid-cols-4); the donuts uniformly use 72 × 72 SVG at every viewport. Badges in the four restyled cards no longer carry uppercase tracking-wider and use the default Badge sizing so they match the rest of the dashboard.
Backend — CPU user / system breakdown samples once per 5 s with the same baseline as cpu_percent
/api/system now exposes cpu_user and cpu_system alongside cpu_usage so the CPU Usage card can drive the User and System mini-bars under the donut. The first iteration called psutil.cpu_times_percent(interval=0) from the request handler — on a fresh process under gevent that returns 0 % for both categories regardless of actual load, because the baseline hadn't been primed since the last call (the same root cause that made the API stop calling psutil.cpu_percent directly and read from the sampler cache instead). The fix moves the breakdown sampling into health_monitor._sample_cpu_usage, the same 5 s tick that already primes cpu_percent, so the three values share one baseline window and read consistently every cycle. The handler now pulls value / user / system from the latest state_history['cpu_usage'] entry. The memory_cached_gb field added in the same pass (RAM cached + buffers) feeds the Memory card's Cached row.
Storage card → "Storage Used", Network Status stacked layout, 24 h chart smoothing
Three small follow-ups on the dashboard restyle:
-
"Total Storage" → "Storage Used". The first card on the Storage tab kept the original "Total Storage" headline with the total capacity figure (Local capacity + Remote capacity), which read confusingly next to a stacked bar that visualizes used portions. The headline now shows the sum of used storage (
totalLocalUsed + totalRemoteUsedthroughformatStorage) and the title reads Storage Used. The bar and the Local / Remote / Free legend below it are unchanged — they were already representing the used breakdown. -
Network Status: stacked cells + packet-loss color. The 2 × 2 grid that exposes Hostname, DNS, Errors, and Domain was inline (
Label: valueon a single row) which truncates long hostnames or full IPv6 DNS addresses. It now stacks the label on top and the value below in each cell so neither column ever wraps. The "Packet Loss" figure picks up a color ramp that mirrors the existing healthy / warning / critical thresholds: blue at 0 %, yellow above 0 %, orange$\ge 1%$ , and red$\ge 5%$ . - 24 h CPU & Network charts: backend downsample to 5-min buckets. The "24 Hours" timeframe on Overview's CPU Usage & Load Average chart and the Network Traffic chart was rendering ~1440 raw minute-level samples from Proxmox RRD, which plots as a dense thicket of vertical spikes. The 1 h and 7 d views were unaffected because their step sizes already produce ~50–300 poi...
v1.2.2
ProxMenux v1.2.2
Stable consolidation of the v1.2.1.x beta cycle. Four prereleases of feature work and fixes land together on the stable channel: a much more configurable Health Monitor (per-category thresholds, per-event dismiss durations, an audit log of active suppressions), a notification stack that reaches ~80 services through Apprise and persists events across Quiet Hours, automatic update detection for LXC containers, and a long list of operator-visible fixes — HTTPS terminal handshakes, kernel update detection on PVE 9.x, NVIDIA installer flow on Alpine, and a quieter Monitor process on idle hosts.
✨ What's new
Health Monitor — more configurable, more granular
Three pieces that together let an operator dial the Health Monitor to their environment instead of working around its defaults.
-
Per-category thresholds. Every check the Health Monitor runs is parameterised by a pair of numbers — a Warning threshold and a Critical threshold — and both are now exposed in Settings → Health Monitor Thresholds. A homelab with a single-disk SSD may want to page earlier on capacity (75 / 90 %), a datacentre host with redundant Ceph nodes can be more relaxed on memory warnings (90 % is normal under ZFS ARC), a passively-cooled mini-PC needs lower temperature thresholds than a server with forced-air cooling. The same numbers also feed the colour ranges of the dashboard widgets — the temperature line in the disk-temperature modal, the bars on the storage cards, the chips on the CPU / memory panels — so the visual classification always matches what actually triggered the alert.
-
Per-event dismiss duration. The Dismiss button on every Health Monitor alert now opens a small dropdown with three options: 24 hours, 7 days or Permanently. The 24h / 7d paths behave like the previous time-limited dismiss; Permanently persists the alert with
suppression_hours = -1, never re-emits, and is marked with a distinct amber Permanent badge so the operator can always see which alerts are intentionally silenced.POST /api/health/acknowledgeaccepts an optionalsuppression_hoursbody field for this; omitting it preserves the previous behaviour (the category's configured default applies). -
Active Suppressions panel. A new section inside Settings → Health Monitor, right below the per-category suppression durations, lists every currently-silenced alert — both time-limited dismisses (with a remaining-time badge like 22h remaining) and permanent ones. Each row carries the
error_key, category, severity, the timestamp the alert was dismissed, plus a Re-enable button that clears the acknowledgment so the alert can fire again on the next scan. The Re-enable action is gated by the Health Monitor Edit mode at the top of the card and is committed alongside any per-category changes on Save. Permanent dismisses can only be reverted from here — the dashboard intentionally does not expose a per-alert un-dismiss affordance. -
Disk I/O severity tiers. Sliding 24 h window classifies dmesg ATA / SCSI errors into silent (0–10), WARNING (11–100) and CRITICAL (100+ or any hard error like UNC / Buffer I/O / Sense Key Hardware Error), so quiet days stay quiet and a single Buffer I/O event still pages immediately.
Notifications — Apprise, Quiet Hours buffering, AI rework
-
Apprise notification channel. One Apprise URL talks to ~80 services (Pushover, ntfy, Slack, Matrix, mailto, signal, Pushbullet, Mattermost, ...) without ProxMenux needing a dedicated adapter for each. The Apprise tab now exposes full feature parity with the native channels: the same Notification Categories block, per-event sub-toggles, Quiet Hours and Daily Digest controls as Telegram, Gotify, Discord and Email. The backend already supported per-channel filtering for Apprise via the generic
channel_overridesblock; the UI just wasn't surfacing it. -
Quiet Hours buffering. Events suppressed during a channel's quiet window are now persisted to SQLite and released as a grouped summary when the window closes, instead of being silently dropped.
-
AI Enhancement, redesigned. The AI Enhancement subsection in Notifications was rewritten from a muted uppercase row that testers consistently scrolled past, to a normal-case foreground label with a leading Sparkles icon and a persistent badge (green Active when AI is enabled, neutral Optional when it isn't) so the feature is visible regardless of state.
Container updates and tooling
-
LXC update detection. A new dedicated section in Settings (between Health Monitor Thresholds and Notifications) with a single toggle that gates the per-CT
apt list --upgradable/apk list -uscan end-to-end. Default ON. When OFF the scan stops entirely (nopct execcalls), everytype=lxcentry is purged from the managed-installs registry immediately, and the matching notification toggle in Notifications → Services disappears from the UI while preserving its stored preference. The checker also reads the mtime of the CT's package-manager metadata cache and refreshes it viapct execif it's older than 24 h — a Debian 12 CT with a 524-day-old cache went from "0 updates" to "117 (12 security)" on lab hardware. -
Post-install function update detection. The Monitor tracks installed ProxMenux optimizations (Log2Ram, Memory Settings, System Limits, Logrotate, ...) and notifies when a newer version of any of them is available, with one-click apply from Settings.
Hardware support
-
NVIDIA driver update notifications. Kernel-aware detection of newer compatible driver versions, surfaced in the Hardware tab and as notifications when an upstream build is published.
-
Coral TPU installer. Uninstall path mirroring the NVIDIA flow, and registry-driven update notifications for both the PCIe
gasket-dkmsdriver (tracked against feranick/gasket-driver) and the USBlibedgetpu1runtime (tracked viaapt). -
Secure Gateway (Tailscale) updates. One-click Tailscale update from Settings with Last-checked / Installed / Latest indicators and notification when a new version is available.
Other improvements
- Helper-Scripts menu — richer context. Each entry now ships more useful information so it's easier to know what every script does before running it.
- Disk temperature monitoring — improved readings, smarter caching across SMART probes, redesigned history modal opening at 24 h by default with min / avg / max statistics.
- VM and LXC modal — expanded so a single panel covers the data you previously had to look up across multiple tabs.
- Page load — faster first paint and lighter network usage on the Overview, Storage and Hardware tabs.
- Security tightening — tighter authentication checks across notification, scripts and terminal endpoints, plus a more conservative default policy for new installs.
🛠️ Notable fixes
-
Terminal modals on HTTPS hosts — every terminal modal (dashboard terminal, LXC terminal, script terminal) used to fail with WebSocket connection error on hosts with HTTPS enabled. Root cause: the
gevent + SSLpath stacked geventwebsocket'sWebSocketHandleron top of flask-sock's protocol implementation, so the server emitted two consecutiveHTTP/1.1 101 Switching Protocolsheaders and the browser closed the connection as a corrupt frame. Droppinghandler_class=WebSocketHandlerrestores a single 101 response and the handshake completes normally. -
Health Monitor kernel updates on PVE 9.x (#208) — the System Updates → Kernel / PVE row reported "Kernel/PVE up to date" on PVE 9.x hosts even when an update for the running kernel was waiting upstream. Three combined fixes: (a) the kernel-package prefix list now includes
proxmox-kernel-*andproxmox-firmware-*(PVE 9.x ships kernels underproxmox-kernel-, notpve-kernel-as in 7.x / 8.x), (b) the dry-run switched fromapt-get upgrade --dry-runtoapt-get dist-upgrade --dry-runso kernel updates packaged as new installs are visible at all, (c) the categoriser readsuname -rand flags an update as a running-kernel update when the package matches the running release. The row now distinguishes "Running kernel update available (reboot required)" from "N kernel update(s) available (none for running kernel)". -
NVIDIA installer kernel compatibility, Alpine LXC and NVENC — the version menu now respects the running kernel compatibility window, only offering driver branches that won't fail to compile. Container-side userspace install reworked so it succeeds on Alpine hosts, and free-space detection works reliably across all storage layouts. When the host has the NVENC patch applied, the version menu narrows to drivers supported by the patch so reinstalling never silently loses it.
-
Apprise integration hardening — three independent fixes:
- Mobile overflow on narrow viewports in the Apprise URL row (placeholder reduced to a single concise example, input wrapper enforces
min-w-0 / flex-1 / shrink-0, examples paragraph usesbreak-all min-w-0). - Backend whitelist rejecting Apprise with HTTP 400. The notifications-test validator's hard-coded channel set (
{telegram, gotify, discord, email, all}) was missingapprise, so every Apprise test or send returned 400 Invalid channel before the library was even invoked. The whitelist is now derived live fromnotification_channels.CHANNEL_TYPESso adding a new channel cannot silently regress this validator again. - Apprise error reporting. When a destination (
jsons://,ntfy://,slack://, ...) returns a non-2xx response, the channel now captures Apprise's internal logger duringnotify()and surfaces the real HTTP status plus the destination's respon...
- Mobile overflow on narrow viewports in the Apprise URL row (placeholder reduced to a single concise example, input wrapper enforces
v1.2.1.4-beta
ProxMenux v1.2.1.4 (Beta)
Fourth beta of the v1.2.1.x cycle. This release ships two
operator-facing improvements that close gaps reported on the
community channels: a granular dismiss flow for Health Monitor
alerts — so a single intentionally-full storage no longer has to
silence an entire category every 24 hours — and full feature parity
for the Apprise notification channel, which now exposes the same
per-event toggles / Quiet Hours / Daily Digest controls as
Telegram, Gotify, Discord and Email. Also fixes a mobile layout
regression in the Apprise settings tab.
Main changes in v1.2.1.4
Per-error dismiss duration — 24 hours, 7 days, or Permanently
Reported on the community channel by a user with an LVM partition
that's full on purpose: every 24 hours the storage CRITICAL
alert came back and the only way to make it stop was to silence the
entire Storage Mounts & Space category for everything else on
the host as well. Dismiss used to be a single action with a single
duration (the category's configured suppression). Now the Dismiss
button on each Health Monitor alert opens a small dropdown with
three options:
- 24 hours — the previous default, behaves exactly as before.
- 7 days — handy for a temporary condition you don't want to
hear about during a week-long migration. - Permanently — silences this specific
error_keyindefinitely.
Persisted assuppression_hours = -1in the persistence DB, never
re-emits and never re-notifies. Marked with a distinct amber
🔒 Permanent badge in the Health Monitor so the operator can
always see which alerts are intentionally silenced.
The backend already supported a permanent-suppression sentinel — the
infrastructure just lacked a UI to set it. The accompanying API
change is small and backwards-compatible:
POST /api/health/acknowledge accepts an optional
suppression_hours body field (positive integer for hours; -1 for
permanent). Omitting the field keeps the existing behaviour
verbatim — the call uses the category's configured suppression.
A second new endpoint POST /api/health/un-acknowledge {error_key}
clears a previously-recorded acknowledgment, so the alert becomes
eligible to fire again on the next scan if the underlying condition
is still present. Used by the new Settings panel below.
Active Suppressions panel — audit log + Re-enable, in Settings
The dismiss dropdown above introduces a need: once a user has
permanently silenced an alert, they need a place to find it again
and un-dismiss it if circumstances change (the disk is being
replaced, the LXC's full pool got resized, the manually-stopped
service was brought back, etc.). A new card lands in
Settings → Health Monitor, between Suppression Duration and
Remote Storage Exclusions:
- Lists every currently-dismissed alert — both time-limited
dismisses (with a remaining-time badge like 22h remaining or
6d remaining) and permanent dismisses (with the 🔒 Permanent
badge from the Health Monitor). - Each row carries the
error_key, the category, the original
severity and the timestamp the dismiss was recorded — enough
context to recognise the alert without having to triangulate
from the Health Monitor itself. - Every row has a Re-enable button that clears the
acknowledgment server-side. The action is gated by the Health
Monitor's Edit toggle at the top of the page, matching the
rest of the Health settings — toggle Edit first, then the
button becomes active. - Permanent dismisses can only be reverted from here. The
Health Monitor itself doesn't expose a per-alert un-dismiss
affordance to avoid accidental re-enables; the Settings panel is
the deliberate audit + revert surface for them. - Time-limited dismisses are also listed and can be force-revived
from this panel without waiting for their countdown to expire.
Apprise — per-event toggles, Quiet Hours and Daily Digest
The Apprise tab was the only notification channel without the
per-event toggles, Quiet Hours and Daily Digest controls that the
other channels (Telegram, Gotify, Discord, Email) all carry. The
backend's per-channel filtering already applied generically to
every channel including Apprise via the channel_overrides block —
the UI just wasn't surfacing the same controls. The Apprise tab now
exposes:
- The full Notification Categories block — same 10 categories
with their sub-event toggles, identical to the other channels. - Quiet Hours — start/end window, with the same per-channel
buffering behaviour (events fired during the window are persisted
and released as a grouped summary when the window closes). - Daily Digest — opt-in daily summary delivery at a chosen time.
The same Send Test button stays at the bottom of the section.
Apprise URL row — mobile overflow fixed
On narrow viewports the Enable Apprise → Apprise URL row used to
push past the right edge of the viewport, breaking the layout for
the entire Notifications card. Two contributing causes:
- The placeholder string packed four full example URLs into a
single line (tgram://bottoken/ChatID · ntfy://server/topic · discord://webhook_id/token · matrix://...), which the browser
could not wrap inside an<input>field — it just clipped the
visible portion and let the input itself overflow the container
on mobile where the container width fell below the natural width. - The "Examples: tgram://, discord://, slack://, ntfy://,
matrix://, pushover://, mailto://" paragraph used inline<code>
tokens with nobreak-allrule, so when the viewport was tight
enough that the natural commas/spaces couldn't accommodate the
line, the whole row scrolled horizontally instead of wrapping.
The placeholder is now a single concise example
(tgram://bottoken/ChatID), the URL input wrapper enforces
min-w-0 / flex-1 / shrink-0 on its children, and the examples
paragraph uses break-all min-w-0 so it wraps cleanly at any
viewport width.
Thanks to @maragath on the community channel for the dismiss
report that drove the per-error dismiss work, and to the testers
who reported the Apprise mobile breakage. Feedback is welcome on
the same channels.
Contributors
Assets 2
v1.2.1.3-beta
ProxMenux v1.2.1.3 (Beta)
Third beta of the v1.2.1.x cycle. This release closes three
distinct issues uncovered after v1.2.1.2 shipped: terminal sessions
silently failed to open on hosts with HTTPS enabled, the LXC update
checker reported zero pending updates on long-running CTs even when
the upstream had hundreds queued, and the AI Enhancement section in
Notifications was invisible enough that several testers reported
never noticing it. The LXC update logic is also re-architected
around a dedicated operator toggle so the per-CT pct exec scan is
properly opt-in and the notification channel behaves consistently
with it.
Main changes in v1.2.1.3
LXC Update Detection — dedicated section, opt-in scan, cache refresh
A new LXC Update Detection card lands in Settings, between
Health Monitor Thresholds and Notifications. It exposes a single
toggle that gates the periodic per-CT apt list --upgradable /
apk list -u scan end-to-end:
- Toggle ON (default). ProxMenux walks every running CT on the
host once per cycle, queries the in-container package manager, and
surfaces the pending update count on the Hardware tab + the
lxc_updates_availablenotification stream. - Toggle OFF. The scan stops entirely (zero
pct execcalls),
everytype=lxcentry is purged from
/usr/local/share/proxmenux/managed_installs.jsonimmediately
instead of waiting for the next 24h cycle, and the matching
per-channel notification toggle in Notifications → Services
disappears from the UI. The notification preference is preserved
in the DB and re-appears at its previous value the moment
detection is re-enabled.
The state is persisted in the user_settings SQLite table as
lxc_updates.detection_enabled and exposed via
GET/POST /api/lxc-updates/detection (auth-gated). The Notifications
component subscribes to a proxmenux:lxc-detection-changed
CustomEvent so the conditional toggle hides/reappears in real time
without a page reload.
LXC update checker — auto-refresh stale apt/apk caches
The checker used to run apt list --upgradable / apk list -u
against whatever the CT's local package cache happened to contain at
that moment. On long-running appliance CTs (a Docker host last
touched in 2024, a Plex CT where only the Plex binary auto-updates,
etc.) the cache could be months out of date and the checker would
honestly report zero pending updates from a frozen snapshot — leaving
real security backlogs invisible.
The checker now reads the mtime of the CT's package-manager metadata
cache (/var/cache/apt/pkgcache.bin on Debian/Ubuntu, the latest
/var/cache/apk/*.tar.gz on Alpine). If the cache is older than 24h
it runs apt-get update -qq / apk update from outside via
pct exec, with a 60s timeout. Any failure (no network, broken repo,
timeout) is swallowed silently — the listing below still runs against
whatever cache exists, so a transient repo issue can never make the
situation worse than the pre-existing CT state. CTs already on a
healthy cadence (unattended-upgrades, cron) keep their fresh
caches and are not touched. Two reproductions on lab hardware: a
Debian 12 CT whose cache was 524 days old went from "0 updates" to
"117 updates (12 security)", a Plex CT went from "0" to "128 (91
security)" of Ubuntu base packages that plexupdate never manages.
Terminal in HTTPS hosts — fix WebSocket connection error on every modal
On hosts with HTTPS enabled in the Monitor, every terminal modal
(the dashboard's full terminal, the LXC terminal modal, the script
terminal modal) failed to connect with [ERROR] WebSocket connection error followed by [INFO] Connection closed. The dashboard worked,
the HTTPS handshake worked, the auth ticket flow worked — but the
moment the browser tried to upgrade to a WebSocket, the connection
dropped.
Root cause: the gevent + SSL path in flask_server.py instantiated
pywsgi.WSGIServer(..., handler_class=WebSocketHandler) on top of a
WebSocket route stack already implemented by flask-sock. Both
layers responded to the client's HTTP upgrade request, so the server
emitted two consecutive HTTP/1.1 101 Switching Protocols
headers — the browser saw the second one as a corrupt WebSocket
frame and closed the connection immediately. Dropping the
handler_class=WebSocketHandler parameter — flask-sock already
provides its own protocol implementation on top of any standard
WSGI server, including gevent.pywsgi.WSGIServer — restores a
single 101 response and lets the handshake complete normally.
Verified on all four lab hosts: HTTPS host now serves one 101, the
three HTTP hosts continue to serve one 101 (they were using the
Flask dev server path which never had this issue).
AI Enhancement section in Notifications — actually visible now
The collapsible Advanced: AI Enhancement row inside the
Notifications card lived in text-xs muted-foreground uppercase
with a chevron icon and no leading badge — testers consistently
reported scrolling past it without noticing the feature existed.
The row is rewritten to use a normal-case text-sm foreground
label, a leading Sparkles icon in purple to match the AI body
underneath, and a persistent badge to the right of the title:
green Active when AI is enabled, neutral Optional when it
isn't. The chevron and the hover affordance survive; the row is
still collapsible and still nested inside Notifications.
Thanks again to the testers — the WebSocket-on-HTTPS report and the
"my old LXC has nothing pending but the binary is 18 months out of
date" report drove most of this beta. Feedback is welcome on the
same channels.
v1.2.1.2-beta
ProxMenux v1.2.1.2 (Beta)
Second beta of the v1.2.1.x cycle. This release closes a series of
real-world issues surfaced after v1.2.1.1 shipped: a server outage
caused by a half-applied Log2Ram resize, ATA disk errors that escaped
the observation log, notifications that doubled up after a burst, and
known-error classifier matches that misread NVIDIA kernel messages as
SATA cable issues. It also extends the managed-installs registry
to the Coral TPU host driver — the gasket-dkms PCIe path and the
libedgetpu USB runtime are now both auto-detected and tracked for
upstream updates, and the installer gains a full uninstall flow
mirroring the NVIDIA one. The disk I/O severity model is replaced by
a sliding 24h window with proper warning / critical tiers so quiet
days stay quiet but a single hard error still pages immediately. The
Quiet Hours pipeline now buffers suppressed events to SQLite and
flushes them at the end of the window instead of silently dropping
them.
Main changes in v1.2.1.2
Coral TPU host driver — uninstall + update tracking
The Coral TPU installer (gpu_tpu/install_coral.sh) gains the same
two-action UX as the NVIDIA installer: on a host that already has
Coral installed (PCIe gasket-dkms, USB libedgetpu1-std/-max, or both)
the script now shows a menu offering Reinstall / update or
Uninstall. The uninstall path unloads the apex/gasket modules,
removes the DKMS registrations for every gasket version, purges the
gasket-dkms / libedgetpu1-std / libedgetpu1-max packages, cleans
up the udev rules, removes the apex system group when nobody else
is using it, and clears the Google Coral apt repo. It is idempotent:
missing pieces are no-ops, never errors.
In parallel, the Coral driver is now a first-class entry in the
managed-installs registry. The detector enumerates both variants
(PCIe → installed gasket-dkms version or DKMS-registered build,
USB → libedgetpu1-std/-max apt version) and the checker queries
the right upstream for each: feranick/gasket-driver tags on GitHub
for PCIe and apt-cache policy for the USB runtime. When a newer
version is available, the same notification pipeline that already
powers the NVIDIA-driver update message fires a
coral_driver_update_available event — one per variant, so a host
with both M.2 and USB Coral devices gets independent update streams.
Disk I/O severity tiers
The disk_io detector no longer treats every dmesg ATA/SCSI error the
same. It now keeps a 24h sliding window of error timestamps per
device and decides severity from the combination of error type,
rate-per-window and the SMART health verdict:
- silent — 0–10 errors/24h, SMART PASSED, no hard error pattern.
The observation is recorded for the disk's history but no
notification fires. - WARNING — 11–100 errors/24h on the same device.
- CRITICAL — 100+ errors/24h, or SMART FAILED, or any hard
error likeBuffer I/O error,UNC,Medium Error,
Unrecovered read error, orSense Key Hardware Error. A single
hard error always pages immediately, regardless of rate.
The 24h same-disk cooldown is keyed by (disk, severity_tier), so a
warning → critical escalation produces a second notification even
within the cooldown window. The pre-existing return-before-record
bug is also fixed: observations are now written to
disk_observations before the SMART gate, so transient errors
that don't yet trip SMART still build the per-disk history.
Quiet Hours — events are no longer dropped
Previously, non-CRITICAL events fired during a channel's Quiet Hours
window were silently dropped. They are now buffered to SQLite (a new
quiet_pending table mirroring the existing digest_pending) and
released as a single grouped summary at the moment the window
closes. CRITICAL still bypasses Quiet Hours and is delivered live.
The channel's quiet_* and digest_* fields are also now returned
by get_settings() so the toggle state correctly reloads on a page
refresh.
log2ram — apply path actually applies
The post-install auto/update flow used to write the new tmpfs size to
/etc/log2ram.conf but didn't restart the log2ram daemon, so a
configured 512M stayed at the original 128M until the operator
restarted manually. The .1.10 server crashed during a backup because
of exactly this. The flow now reloads systemd, restarts log2ram and
rsyslog, and re-runs log2ram clean / write, so the new size
takes effect on the running tmpfs immediately.
VM/CT control — real errors instead of bare 500s
Failed pvesh start/stop/restart operations now surface the actual
pvesh stderr (e.g. "no space left on device", "Configuration file 'nodes/.../qemu-server/100.conf' does not exist") instead of a
bare 500 INTERNAL SERVER ERROR. The backend also fires a
vm_fail / ct_fail notification on every failed control action so
the operator sees it on Telegram even if they were not looking at
the dashboard at that moment.
Notification pipeline — four correctness fixes
- Known-error classifier no longer misreads kernel messages. The
proxmox_known_errorsregexata.*error(case-insensitive) was
matchingf**atal**Er**ror**inside NVIDIA's
nvidia_uvm: Unknown symbol nvUvmInterfaceReportFatalErrorand
labelling it as "ATA communication error with disk — check SATA
cables". The pattern is now anchored:\bata\d.*\berror\brequires
a word boundary beforeataand a digit immediately after (as in
ata1,ata2.00), so it still catches real ATA logs but no
longer matches embedded substrings.UNCis also word-bounded. - Burst summaries don't double-count. When the first event of a
burst was already sent individually on the fast-alert path, the
burst summary kept reporting the total count, which made the
operator see "1 system problem" individual + "2 system problems"
burst within seconds. Burst summaries now report the additional
count ("+N more X in window — N+1 total"), and the wording on
every burst template is updated to match. - Health journal context no longer pastes unrelated lines. The
AI's "📝 Log:" footer in degraded-health notifications was filling
with whatever systemd happened to log within the same 10-minute
window — including the Monitor's own watchdog killing a stuck
subprocess. The grep prefilter now excludes
proxmenux-monitor.serviceso self-logs never leak into the
context of an unrelated event. - "Resolved" notifications report the severity the user actually
saw. Previously, if an error fired WARNING, silently escalated
to CRITICAL during its 24h same-key cooldown, and then resolved,
the recovery message read "previous severity: CRITICAL" — a value
the operator had never seen in any notification. The recovery now
uses the severity that was actually delivered at notification
time, not whatever later value the DB ended up holding.
Frontend polish
- Quiet Hours and Daily Digest time inputs redesigned for mobile.
The cramped two-column grid that overflowed on narrow screens is
replaced by inline labels and full-height time pickers. - 401 cascade recovery on the Login screen — the dedup flag is
cleared on mount and on a successful login so a brief stale-token
state no longer leaves the user staring at a blank dashboard
forever. - API error parsing — the frontend
fetchApiwrapper now
extracts{error}/{message}from the JSON body before
throwing, so toast messages on VM control failures, scripts,
notifications and similar endpoints show the real backend reason
instead ofAPI request failed: 500 INTERNAL SERVER ERROR.
Thanks again to the testers who keep finding the edge cases — the
SIGKILL-leaking-into-the-wrong-event report and the
fatalError-classified-as-ATA report were both reproduced live and
fixed in this beta. Feedback is welcome on the same channels.
v1.2.1.1-beta
ProxMenux v1.2.1.1 (Beta)
First beta of the v1.2.1.x cycle. The headline area is update
awareness across ProxMenux Monitor: the dashboard now detects and
surfaces a new release of the NVIDIA host driver, of the Tailscale
container that powers Secure Gateway, and of the post-install
optimization functions ProxMenux applies to the host. This release
also brings configurable Health Monitor thresholds, an expanded VM/LXC
modal, a redesigned disk temperature history, and a series of
hardening passes on the NVIDIA installer for Alpine LXCs and
kernel-aware version selection. Internally, the notification stack
gains quiet hours, a daily digest of informational events, and a
unified anti-cascade rule, alongside performance and security polish
across the monitoring code.
Main changes in v1.2.1.1
Update Awareness Across ProxMenux Monitor
ProxMenux Monitor now keeps track of the third-party software that
ProxMenux helps you install on the host and tells you when something
upstream has moved.
NVIDIA host driver — kernel-aware detection of newer compatible
driver versions. The Hardware tab's GPU card shows a discreet
"Driver vX.Y available" line under the kernel-module row when an
update is published upstream, and a notification fires once per new
version. The check respects the running kernel: if your current branch
is no longer compatible, the recommendation upgrades to the kernel's
recommended branch with an explicit reason; otherwise it stays inside
your current branch so you don't move to a more aggressive series than
you signed up for.
Secure Gateway / Tailscale — the Settings page for Secure Gateway
gains a "Last checked · Tailscale vX installed · Latest available"
line and a one-click Update button when a new Tailscale build is
available inside the gateway container. Notifications fire when the
upstream release is detected, with an explicit upgrade hint pointing
at the same Update button.
Post-install optimization functions — Log2Ram, Memory Settings,
System Limits, Logrotate and similar host optimizations applied
through the Post-Install menu now carry a version. Whenever a new
version of any of them is published, the Monitor lists them in the
ProxMenux Optimizations panel and emits a single notification
("4 ProxMenux optimization update(s) available") with one line per
tool, in the same tool (vX → vY) format used for Proxmox package
updates. The user applies them either from Settings → ProxMenux
Optimizations or directly from the Post-Install menu.
All three flows share the same registry under the hood, so
adding a new tracked install in future releases (Coral TPU, Frigate,
…) is a matter of adding a detector — the notification, polling and
UI surface come for free.
Health Monitor Thresholds
Per-category warning and critical levels for CPU, memory,
temperature, storage and the rest of the health monitor's checks are
now fully configurable from Settings → Health Monitor. Each
category has its own pair of thresholds with sensible defaults; the
operator can lower them to be paged earlier, raise them to silence a
noisy host, or leave them untouched for the default behaviour. Values
persist across restarts and apply to both in-app warnings and the
notification pipeline.
Hardware & Storage UX
Expanded VM and LXC modal — the modal opened from the VMs &
LXCs tab consolidates a lot of information that previously required
hopping across multiple tabs. Backups, networking, mounted volumes,
GPU passthrough state and recent task activity are now reachable from
a single panel.
Disk temperature monitoring rework — readings are more accurate
on drives that report SMART data inconsistently between probes,
sample caching is shared across SMART operations to reduce the load
on busy hosts, and the redesigned history modal opens at 24 h by
default with a min / avg / max statistics row so the at-a-glance
state is meaningful from the first second. The 1 h / 7 d / 30 d
ranges are still one click away.
GPU card update line — the NVIDIA Hardware card gains a discreet
update notice when a newer compatible driver is published, mirroring
the Secure Gateway "Last checked / Latest" pattern.
NVIDIA Installer — Hardening
A round of fixes that close real installation failures community
testers hit during the v1.2.0.x cycle.
Kernel-aware version filter — the version-selection menu used to
offer every driver compatible with the host's MIN_DRIVER_VERSION
floor (kernel 6.14 → 550+ → drivers 590.x and 595.x showed up). In
practice 595.x has historically failed to compile against this kernel
family, leaving users with a broken install they then had to roll
back. The menu now stays inside the user's installed branch when it's
still compatible, and falls back to the recommended branch otherwise.
The "Latest available" label reflects the highest version actually
offered, not the global upstream latest.
NVENC patch awareness — when the host has the keylase NVENC patch
applied (visible as patched: true in components_status.json), the
version menu narrows to drivers the patch's patch.sh actually
supports, cached for seven days. Reinstalling onto a driver outside
that list would otherwise silently lose the patch — the user would
return to a base driver without realising it. A note above the
version list makes it clear when the filter is in effect.
Alpine LXC userspace install — the previous apk add nvidia-utils
branch never worked: that package does not exist in Alpine
main/community. Alpine LXCs are now handled through the same
extracted-.run path used by Debian and Ubuntu, with gcompat and
binutils pulled into the container so the glibc binary loader and
SONAME generation work in a musl environment. End result: a fresh
NVIDIA driver install on an Alpine LXC reaches nvidia-smi from the
host's exact same version with no manual steps.
Free-space detection on BusyBox df — the LXC pre-flight check
that asks for at least 1.5 GB free was reading column 4 of the second
output line of df, which BusyBox splits into two physical lines
when the filesystem name is too long (typical of ZFS subvolumes like
rpool/data/subvol-104-disk-0). The check now uses df -P POSIX
output and reads the last line, so the "Insufficient Disk Space"
warning never fires on a perfectly normal 5 GB Alpine LXC.
Upstream version regex — the parser that scrapes
download.nvidia.com/XFree86/Linux-x86_64/ for available versions
now accepts both single and double quotes in the directory listing.
The previous regex was double-quote-only; NVIDIA serves the listing
with single quotes, so detection silently returned an empty list and
the Monitor reported "could not reach download.nvidia.com" even
though the URL was perfectly reachable.
Documentation — HTTPS / ACME / Self-Signed Trust
The HTTPS doc page (/docs/security/ssl-letsencrypt) is the entry
point for a step-by-step Proxmox ACME tutorial: registering the
account, adding a DNS-01 plugin, binding the domain, ordering the
certificate from the CLI or the GUI, and verifying the issuer. Once
/etc/pve/local/pveproxy-ssl.pem is signed by Let's Encrypt, the
Monitor's existing auto-detect picks it up — no extra renewal job to
maintain.
A new section, "Trust the Proxmox self-signed CA", covers the
case where the operator prefers to keep the default Proxmox-generated
certificate instead of going through ACME. It walks through copying
/etc/pve/pve-root-ca.pem to a client and importing it into Linux
(update-ca-certificates), macOS (Keychain Access), Windows
(Trusted Root Certification Authorities) and Firefox (which uses its
own store). For a clustered Proxmox setup the CA file lives on the
shared pmxcfs, so a single import covers every node; standalone
hosts each have their own root and need to be imported individually.
Helper-Scripts Menu — Richer Context
The Proxmox VE Helper-Scripts entries in the Post-Install menu now
ship richer context for each script. Where the menu previously
showed just a name and a one-line description, every entry can now
carry additional information that explains what the script actually
does, the resources it touches and the typical scenarios it fits.
The goal is to let the operator decide whether to run something
before running it instead of after.
Notification System — Refinements
A round of internal refinements in the notification pipeline that
the operator notices as quieter, more useful messages without having
to configure anything new.
Anti-cascade by default — the same recurring problem now produces
a single notification per 24 h instead of a flood. Sustained-state
events (CPU at 95 %, temperature high, memory under pressure) keep
their per-category cadence so the operator stays informed while the
condition lasts; one-shot recurring bugs (segfaults, OOMs, kernel
warnings) no longer ping every time a cron job re-triggers them.
Backups, VM/CT state changes and urgent events keep their fast
delivery. The change applies project-wide and respects the existing
per-channel category toggles.
Quiet hours per channel — every channel can now define a window
during which only CRITICAL events reach it. A live preview line
shows whether the window is active right now and when the next
transition is. Each channel is independent, so Telegram can be silent
between 22:00 and 06:00 while email continues to receive everything.
Daily digest of INFO events — opt-in per channel. When enabled,
informational events (backup completed OK, post-install update
available, …) accumulate during the day and...
v1.2.1: Merge pull request #187 from MacRimi/develop
ProxMenux v1.2.1
Maintenance release on top of v1.2.0 focused on three community-reported
areas: full SR-IOV awareness across the GPU/PCI subsystem, GPU + audio
companion handling during passthrough attach and detach (Intel iGPU with
chipset audio, discrete cards with HDMI audio, mixed-GPU VMs), and
compatibility fixes for the AI notification providers (OpenAI-compatible
custom endpoints such as LiteLLM/MLX/LM Studio, OpenAI reasoning models,
and Gemini 2.5+/3.x thinking models). Also bundles quality-of-life fixes
in the NVIDIA installer, the disk health monitor, and the LXC lifecycle
helpers used by the passthrough wizards.
Main changes in v1.2.1
SR-IOV Awareness Across the GPU Subsystem
Intel i915-sriov-dkms and AMD MxGPU split a GPU's Physical Function (PF)
into Virtual Functions (VFs) that can be assigned independently to LXCs and
VMs. Until now ProxMenux had zero SR-IOV awareness: it treated VFs and PFs
identically, which could rewrite vfio.conf with the PF's vendor:device ID,
collapse the VF tree on the next boot, and leave users unable to start their
guests. Every path that could have disrupted an active VF tree has been
audited and hardened.
Detection helpers — new _pci_is_vf, _pci_has_active_vfs,
_pci_sriov_role, _pci_sriov_filter_array in
scripts/global/pci_passthrough_helpers.sh. The HTTP/JSON equivalent lives
in the Flask GPU route, so the Monitor UI reads VF/PF state directly from
sysfs (physfn, sriov_totalvfs, sriov_numvfs, virtfn*).
Pre-start hook (gpu_hook_guard_helpers.sh) — the VM pre-start guard
now recognises Virtual Functions. Both the slot-only syntax branch (where
it used to iterate every function of the slot and demand vfio-pci
everywhere) and the full-BDF branch skip VFs, so Proxmox can perform its
per-VF vfio-pci rebind as usual. The false "GPU passthrough device is not
ready" block on SR-IOV VMs is gone.
Mode-switch scripts refuse SR-IOV operations — switch_gpu_mode.sh,
switch_gpu_mode_direct.sh, add_gpu_vm.sh, add_gpu_lxc.sh,
vm_creator.sh, synology.sh, zimaos.sh, add_controller_nvme_vm.sh.
Selecting a VF or a PF with active VFs now triggers a clear "SR-IOV
Configuration Detected" dialog and aborts before any host-side VFIO
rewrite. For the VM-creation wizards the message is delivered through
whiptail so it interrupts the mid-flow output and is acknowledged
explicitly, followed by a per-device msg_warn line for the log trail.
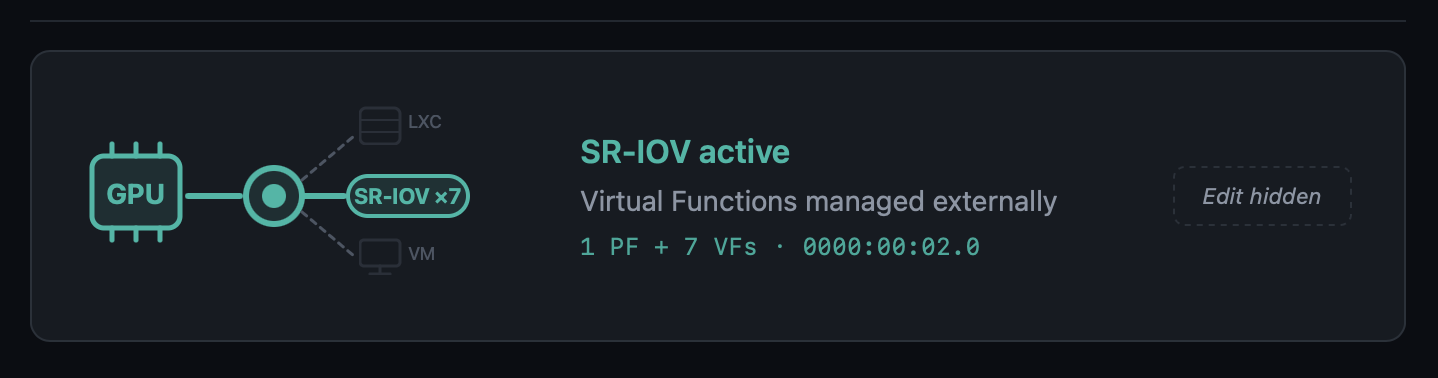
New "SR-IOV active" state in the Monitor UI — the GPU card in the
Hardware page gains a third visual state with a dedicated teal colour,
an in-line SR-IOV ×N pill (or SR-IOV VF for a Virtual Function), and
dashed/faded LXC and VM branches. The Edit button is hidden because the
state is hardware-managed.
Modal dashboard for SR-IOV GPUs — opening the modal for a Physical
Function with active VFs now shows:
- Aggregate-metrics banner ("Metrics below reflect the Physical Function
(aggregate across N VFs)") - Normal GPU real-time telemetry for the PF
- A Virtual Functions table, one row per VF, with the current driver
(i915,vfio-pci, unbound) and the specific VM or LXC that consumes
it, including running/stopped state. Consumers are discovered by
cross-referencinghostpcientries and/dev/dri/renderDNmount lines
against the VF's BDF and DRM render node.
Opening the modal for a Virtual Function shows its parent PF (clickable
to navigate back to the PF's modal), current driver, and consumer.
VM Conflict Policy popup no longer fires for SR-IOV VFs — the regex
in detect_affected_vms_for_selected matched the slot (00:02) against
VMs that had a VF (00:02.1) assigned, producing a confusing "Keep GPU
in VM config" dialog. With the SR-IOV gate upstream, the flow never
reaches that code path for SR-IOV slots, so the false conflict is gone.
Thanks to the community bug report that surfaced this whole area and
included the pointer to /sys/bus/pci/devices/<BDF>/physfn as the VF
marker.
AI Provider Compatibility — OpenAI-Compatible, Reasoning, and Thinking Models
Three coordinated fixes that unblock model categories previously rejected
by the notification enhancement pipeline.
OpenAI-compatible endpoints (LiteLLM, MLX, LM Studio, vLLM, LocalAI,
Ollama-proxy, ...) — the provider's list_models() used to require
"gpt" in every model name, so local setups serving mlx-community/...,
Qwen3-..., mistralai/... saw an empty model list. When a Custom Base
URL is set, the "gpt" substring check is now skipped and
EXCLUDED_PATTERNS (embeddings, whisper, tts, dall-e) is the only
filter. The Flask route layer also stops intersecting the result against
verified_ai_models.json for custom endpoints — the verified list only
describes OpenAI's official model IDs and was erasing every local model
the user actually served.
OpenAI reasoning models (o1, o3, o3-mini, o4-mini, gpt-5,
gpt-5-mini, gpt-5.1, gpt-5.2-pro, gpt-5.4-nano, etc., excluding
the *-chat-latest variants) — these use a stricter API contract that
requires max_completion_tokens instead of max_tokens and does not
accept temperature. Sending the classic chat parameters produced HTTP
400 Bad Request for every one of them. A detector in openai_provider.py
now branches the payload accordingly. The payload also sets
reasoning_effort: "minimal" for these models: by default they consume
their output token budget on internal reasoning and return an empty
reply for short requests like notification translation, and minimal
keeps that overhead low so the visible response fits inside the
notification budget.
Gemini 2.5+/3.x thinking models — gemini-2.5-flash, 2.5-pro,
gemini-3-pro-preview, gemini-3.1-pro-preview, and others have
internal "thinking" enabled by default. With the small token budget used
for notification enrichment (≤250 tokens), the thinking budget consumed
the entire allowance and the model returned empty output with
finishReason: MAX_TOKENS. gemini_provider.py now sets
thinkingConfig.thinkingBudget: 0 for non-lite variants of 2.5+ and
3.x, so the available tokens go to the user-visible response. Lite
variants (which don't have thinking enabled) are untouched.
Thanks to the community bug report about LiteLLM → MLX that prompted the
first fix and led to auditing the other two.
Verified AI Models Refresh
AppImage/config/verified_ai_models.json refreshed for the providers we
re-tested against live APIs:
| Provider | New recommended | Notes |
|---|---|---|
| OpenAI | gpt-4.1-nano |
gpt-4.1-nano, gpt-4.1-mini, gpt-4o-mini, gpt-4.1, gpt-4o, gpt-5-chat-latest, plus the new gpt-5.4-nano / gpt-5.4-mini from the 2026-03 generation. Dated snapshots and legacy models (gpt-3.5-turbo*, gpt-4-0613) are excluded in favour of stable aliases. Reasoning models (o*, gpt-5 non-chat) are supported by the code but not listed by default — they are slower/costlier without improving notification quality. |
| Gemini | gemini-2.5-flash-lite |
gemini-2.5-flash-lite, gemini-2.5-flash (works now with the thinking-budget fix), gemini-3-flash-preview. The gemini-flash-latest / gemini-flash-lite-latest aliases are intentionally omitted — they resolved to different underlying models across verifier runs and produced timeouts in some regions. Pro variants reject thinkingBudget=0 and are overkill for the notification-translation use case. |
| Groq / Anthropic / OpenRouter | unchanged | Marked with a _note — will be re-verified as soon as keys are available. |
A new private maintenance tool (kept out of the AppImage) re-runs a
standardised translate+explain test against every model each provider
advertises, classifies pass / warn / fail, and prints a ready-to-paste
JSON snippet. Re-run before each ProxMenux release to keep the list
current.
Disk Health Monitor — Observation Persistence in the Journal Watcher
A latent bug in notification_events.py::_check_disk_io meant real-time
kernel I/O errors caught by the journal watcher were surfaced as
notifications but never written to the permanent per-disk observations
table. In practice the parallel periodic dmesg scan usually wrote the
observation shortly after, so no data was lost in typical cases — but
under timing edge cases (stale dmesg window, service restart right
after the error, buffer rotation) the observation could go missing.
The journal watcher now records the observation before the 24h
notification cooldown gate, using the same family-based signature
classification (io_<disk>_ata_connection_error,
io_<disk>_block_io_error, io_<disk>_ata_failed_command) as the
periodic scan. Both paths now deduplicate into the same row via the
UPSERT in record_disk_observation, so occurrence counts are accurate
regardless of which detector fired first.
NVIDIA Installer Polish
lsmod race condition silenced — during reinstall, the module-unload
verification in unload_nvidia_modules produced spurious
lsmod: ERROR: could not open '/sys/module/nvidia_uvm/holders' errors
because lsmod reads /proc/modules and then opens each module's
holders/ directory, which disappears transiently while the module is
being removed. The check now reads /proc/modules directly and inserts
short sleeps to let the kernel finalise the unload before re-verifying.
Applied in the same spirit to the four other lsmod call sites in the
script.
Dialog → whiptail in the LXC update flow — t...
v1.2.0
ProxMenux v1.2.0

Final release of the v1.2.0 cycle. This version consolidates the work from the v1.1.9.1 → v1.1.9.6 beta series and introduces the biggest evolution of ProxMenux Monitor to date: AI-enhanced notifications, a redesigned multi-channel notification system, a reworked hardware and storage experience, and broad performance improvements across the monitoring stack. It also consolidates all recent work on the Storage, Hardware and GPU/TPU scripts.
Main changes in v1.2.0
AI-Enhanced Notifications
Notifications can now be enhanced using AI to generate clear, contextual messages instead of raw technical output. Instead of backup completed exitcode=0 size=2.3GB, AI produces: "The web server backup completed successfully. Size: 2.3GB".
- Multi-Provider Support: Groq, Google Gemini, OpenAI, Anthropic Claude, OpenRouter and Ollama (local)
- Per-Provider API Keys: switch providers without re-entering credentials
- Verified AI Models: curated list (
verified_ai_models.json) tested for notification enhancement; daily verification auto-migrates to a verified alternative if the current model becomes unavailable - Per-Provider Model Memory: your selected model is preserved per provider
- Customizable Detail Level: minimal, standard or detailed per channel
- Multi-Language Support: messages generated in your preferred language
- Custom AI Prompts: full control over format and translation, with export/import and an example template
- Enriched Context: selective uptime, event frequency, SMART data, and known Proxmox errors passed to the AI for better diagnosis
AI only translates technical notifications into readable messages — it is not a chatbot, does not analyze your system, does not execute commands, and does not store history.
Notification System Redesign
- Multi-Channel Architecture: Telegram, Discord, Pushover, Email and Webhook simultaneously
- Per-Event Configuration: enable/disable specific event types per channel
- Channel Overrides: customize notification behaviour per channel
- Secure Webhook Endpoint: authenticated endpoint for external systems
- Encrypted Storage: API keys and sensitive data stored encrypted
- Queue-Based Processing: background worker with automatic retry
- Telegram Topics Support: send notifications to a specific topic inside Topic-enabled groups
- Dashboard Update Indicator: the ProxMenux logo changes to an update variant when a new version is detected (stable and beta channels)
- ProxMenux Update Notifications: automatic detection of new versions via
version.txtandbeta_version.txt
Hardware Panel — Expanded Detection
- SCSI / SAS / RAID Controllers: model, driver and PCI slot shown in the storage controllers section
- PCIe Link Speed Detection: NVMe drives show current link speed (PCIe generation and lane width), making it easy to spot drives underperforming due to limited slot bandwidth
- Enhanced Disk Detail Modal: NVMe, SATA, SAS and USB drives expose their specific fields (PCIe link info, SAS version/speed, interface type)
- Smarter Disk Type Recognition: uniform labelling for NVMe SSDs, SATA SSDs, HDDs and removable disks
- Hardware Info Caching (
lspci,lspci -vmm): 5 min cache avoids repeated scans for data that doesn't change
Storage Overview — Health, Observations, Exclusions
Disk Health Status Alignment
- Badges now reflect the current SMART state, not a historical worst value
- Historical findings remain accessible via the "X obs." badge
- Automatic recovery when SMART reports healthy again
- Removed the old
worst_healthtracking that required manual clearing
Disk Registry Improvements
- Smart serial lookup prevents duplicate entries when a disk appears with/without a serial
- Better handling of USB drives that may appear under different device names
Storage and Network Interface Exclusions
- Storage Exclusions: exclude drives from health monitoring and notifications
- Network Interface Exclusions: new section for excluding bridges (
vmbr), bonds, physical NICs and VLANs from health/notifications - Separate toggles for Health monitoring and Notifications
Disk Detection Robustness
- Power-On-Hours validation detects and corrects absurdly large values from drives with non-standard SMART encoding
- Intelligent bit masking extracts correct data from drives that encode extra info in high bytes
- Graceful "N/A" fallback when data cannot be parsed
Health Monitor & Error Lifecycle
Stale Error Cleanup
- Errors for deleted VMs/CTs and removed disks are automatically resolved
- Cluster errors clear when a node leaves the cluster
- Log-based errors auto-resolve after 48 hours without recurrence
- Security update notifications auto-resolve after 7 days
Database Migration System
- Automatic detection and addition of missing columns on startup
- Schema compatibility with old and new column naming
- Backwards compatible with older ProxMenux databases
- No data loss during schema updates
VM / CT Detail Modal and Mobile UX
- Tabbed Navigation: Overview and Backups tabs
- Visual Enhancements: icons, improved hierarchy, better VM vs CT distinction
- Mobile Responsiveness: correctly adapts to small screens in both webapp and direct browser access
- Secure Gateway Modal: scrollable storage list and mobile-adapted layout
- Terminal Connection: reconnection loop fix affecting mobile devices, improved WebSocket handling and more graceful timeout recovery
- Fail2ban & Lynis Management: delete buttons added in Settings with confirmation dialog
Performance Optimizations
Staggered Polling Intervals
| Collector | Schedule |
|---|---|
| CPU sampling | Every 30s at offset 0 |
| Temperature sampling | Every 15s at offset 7s |
| Latency pings | Every 60s at offset 25s |
| Temperature record | Every 60s at offset 40s |
| Health collector | Starts at 55s offset |
| Notification polling | Health=10s, Updates=30s, ProxMenux=45s, AI=50s |
Cached System Information
| Command | Cache TTL | Impact |
|---|---|---|
pveversion |
6 hours | Eliminates 23%+ CPU spikes from Perl execution |
apt list --upgradable |
6 hours | Reduces package manager queries |
pvesh get /cluster/resources |
30 seconds | 6 API calls per request reduced to 1 |
sensors |
10 seconds | Temperature readings cached between polls |
smartctl (SMART health) |
30 minutes | Disk health checks reduced from every 5 min |
lspci / lspci -vmm |
5 minutes | Hardware info cached |
journalctl --since 24h |
1 hour | Login attempts count cached (92% reduction) |
Increased journalctl Timeouts
| Query Type | Before | After |
|---|---|---|
| Short-term (3-10 min) | 3s | 10s |
| Medium-term (1 hour) | 5s | 15s |
| Long-term (24 hours) | 5s | 20s |
Reduced Polling Frequency
TaskWatcherinterval raised from 2s → 5s (60% fewer checks)
GitHub Actions
- All workflow actions upgraded to v6 for Node.js 24 compatibility
Scripts — Storage, Hardware and GPU/TPU Work
This release also consolidates significant work on the core ProxMenux scripts.
Storage
- SMART scheduled tests and improved interactive SMART test workflow
- Disk formatting rework (
format-disk.sh) with safer device selection - Disk passthrough for VMs and CTs — updated device enumeration, serial-based identification, cleaner teardown
- NVMe controller addition for VMs — improved controller type selection and slot detection
- Import disk image — smoother path validation and progress reporting
- Disk & storage manual guide refresh
Hardware / GPU / TPU
- Coral TPU installer updated for current kernels and udev rules (Proxmox VE 8 & VE 9)
- NVIDIA installer — cleaner driver installation, kernel header handling, VM/LXC attachment flow
- GPU mode switch (direct and interactive variants) — safer switching between iGPU modes
- Add GPU to VM / LXC — unified selection dialogs and permission handling
- Intel / AMD GPU tools kept in sync with the new shared patterns
- Hardware & graphics menu restructured for consistency
UI Flow Consistency
All recently-touched scripts follow the unified msg_info / stop_spinner / show_proxmenux_logo pattern between dialog menus and during the main execution phase — cleaner transitions and no more spinner artifacts over dialogs.
📦 Current project structure
ProxMenux is organized into modular, interactive menus designed for managing and customizing a Proxmox VE system:
- Post-Install Settings for Proxmox
- Hardware: GPU and Coral TPU Tools
- Create VMs from Templates or Scripts
- Disk and Storage Manager
- Mount and Share Manager
- Essential Proxmox VE Helper Scripts
- Network Tools and Tweaks
- System Settings and Optimization
- Help and Info Commands
- ProxMenux Monitor
Thank you for using ProxMenux!
Feel free to report issues or suggest improvements — all contributions are welcome 🙌.
v1.1.9.5: Update security note in README.md
ProxMenux v1.1.9.5 (Beta)
This release improves mobile responsiveness, adds Network Interface Exclusions, enhances the VM/CT detail modal with tabbed navigation, and includes AI notification improvements.
Main changes in v1.1.9.5
Network Interface Exclusions
Users can now exclude network interfaces from health monitoring and notifications, similar to Storage Exclusions.
- Use Case: Interfaces intentionally disabled (e.g., unused bridges) no longer trigger false alerts
- Granular Control: Separate toggles for Health monitoring and Notifications
- New Settings Section: Accessible from Settings page alongside Storage Exclusions
- Interface Types: Supports bridges (vmbr), bonds, physical NICs, and VLANs
VM/CT Modal Improvements
The VM/CT detail modal has been completely redesigned for better usability.
Tabbed Navigation
- Overview Tab: General information, status, and resource usage
- Backups Tab: Dedicated section for backup history with improved layout
Visual Enhancements
- Added icons throughout for better visual clarity
- Improved information hierarchy and spacing
- Better distinction between VM and CT specific data
Mobile Responsiveness
- Modal now properly adapts to mobile screens in both webapp and browser access
- Content no longer overflows on smaller devices
- Touch-friendly button sizes and spacing
Secure Gateway Modal Improvements
The installation modal for Secure Gateway now handles long storage lists gracefully.
- Scrollable Storage List: When many storage destinations are available, the list scrolls instead of overflowing
- Mobile Optimization: Modal adapts to smaller screens
- Improved Layout: Better spacing and visual hierarchy
Fail2ban and Lynis Management
Added delete functionality for security tools installed via ProxMenux.
- Delete Button: Now available in Settings for both Fail2ban and Lynis sections
- Clean Removal: Properly removes packages and configuration files
- Confirmation Dialog: Prevents accidental deletions
Terminal Connection Improvements
Fixed connection issues that affected mobile devices.
- Connection Loop Fix: Resolved issue where terminal would get stuck in a reconnection loop
- Mobile Stability: Improved WebSocket handling for mobile browsers
- Better Timeout Handling: More graceful connection error recovery
AI Notification Enhancements
Several improvements to the AI-powered notification system.
Enriched Context
- System uptime now included (helps distinguish startup vs runtime errors)
- Event frequency tracking (indicates recurring vs one-time issues)
- SMART disk health data passed to AI for disk-related errors
- Known Proxmox errors database for accurate diagnosis
Improved Prompts
- Clearer instructions to prevent AI hallucinations
- Better handling of emoji placement (start of lines only)
- Explicit rules for using known error database information
Stale Error Cleanup
- Automatic resolution of errors for deleted resources (VMs, disks, interfaces)
- Log errors auto-resolve after 48 hours
- Cluster errors resolve when node leaves cluster
Bug Fixes
- Fixed indentation error in notification manager that prevented startup
- Fixed database column reference in cleanup function
- Improved error handling for network interface detection
v1.1.9.4
ProxMenux v1.1.9.4 (Beta)
This release adds Telegram Topics support, visual update indicators, Groq connection improvements, and continued performance optimizations.
Main changes in v1.1.9.4
Telegram Topics Support
Notifications can now be sent to specific topics within Telegram groups that have Topics enabled.
- Topic ID Configuration: New optional field to specify which topic receives notifications
- Automatic Detection: System detects if your group uses topics
- Backwards Compatible: Groups without topics continue working as before
To find your Topic ID, check the URL when viewing a topic: https://t.me/c/XXXXX/123 - the last number (123) is the Topic ID.
Dashboard Update Indicator
The ProxMenux logo now visually indicates when updates are available.
- Dynamic Logo: Logo changes to update variant when new versions are detected
- Non-Intrusive: No popups or banners - just a subtle visual cue
- Dual Channel: Indicates updates for both stable and beta versions
- Persistent State: Status stored in config.json, reset by update scripts
Groq Provider Fix
Resolved connection issues with the Groq AI provider.
- Fixed JSON Parsing: Corrected response handling for Groq's API format
- Improved Error Handling: Better timeout and connection error management
- Model Compatibility: Ensured compatibility with latest Groq model endpoints
Performance Optimizations
Additional improvements to reduce system resource usage.
Optimized API Response Caching
| Resource | Cache TTL | Benefit |
|---|---|---|
| Cluster resources | 30s | Reduced API calls from 6 to 1 per request |
| Sensor readings | 10s | Prevents redundant temperature queries |
| SMART data | 30 min | Disk health cached between polls |
| Hardware info (lspci) | 5 min | Static data cached appropriately |
GitHub Actions Updated
- Upgraded all workflow actions to v6 for Node.js 24 compatibility
- Eliminates deprecation warnings in CI/CD pipeline
Disk Detection Improvements
Enhanced parsing of SMART data for drives with non-standard value encoding.
- Power On Hours Validation: Detects and corrects absurdly large values (billions of hours)
- Intelligent Bit Masking: Extracts correct data from drives that encode extra info in high bytes
- Graceful Fallback: Shows "N/A" instead of impossible values when data cannot be parsed