Automatically generate synthetical yet realistic distribution networks based on open data
The GridCreator is a tool for automated generation of synthetic low-voltage networks based on open data. Currently we use data from
- ding0
- OpenStreetMap (osm)
- Zensus 2022
- Marktstammdatenregister
The tool builds up on existing projects and databases and combines them in a single tool to cover the whole pipeline from choosing an area and timerange to having a fully parametrised distribution grid. This is achieved in five steps, that can either be executed individually or subsequently (see also https://github.com/INATECH-CIG/GridCreator/blob/main/Steps.pdf):
- Step 1: load grid data from ding0 for specified coordinates
- Step 2: Load sozio-economic data from census for the specified coordinates and attach them to network nodes
- Step 3: Load data on installed units for specified coordinates; distribute PV, Battery Storage, EVs and Heat Pumps according to socio-economic correlations from Step 2 to all nodes in the network
- Step 4: Include weather data and generate time series for PV generation, demand and Heat Pump operation based on this. Also generate profiles for occupancy and EV availability
- Step 5: Prepare the network for optimization with PyPSA
- Clone the repository and navigate to its directory:
git clone https://github.com/INATECH-CIG/GridCreator.git
cd GridCreator- Set up an environment
conda create -n GridCreator python=3.12.11- Install required packages
conda activate GridCreator
pip install -r requirements.txtDownload input.zip containing weather data, zensus data and ding0 grids from zenodo: https://zenodo.org/records/17884917 Unpack and place the folder "input" in your GridCreator repository. The subfolders "grids", "weather_2013", "zensus_daten" and the files should for example be in C:/Users/YourName/GridCreator/input
Getting Started
- Install the repository as described in the Installation section.
- Add the input data as described in the Necessary Input Data section.
- Run main.py.
- A grid for South Berlin (line 222) is created by default.
- You can change the scenario by selecting another predefined example (line 222).
- Add your own scenario using a custom bounding box (bbox).
- Add the bounding box with a specified name to the examples dictionary in main.py (line 173).
- Run main.py and select the new scenario name (line 222).
It is possible to execute the GridCreator step by step in order to manually manipulate the data.
The steps to be executed can be defined in main.py (line 223).
- Run Step 1 to generate the grid.
- Modify or replace the generated grid before proceeding.
- Run Step 2 to assign OpenStreetMap (OSM) data.
- Additional Germany-specific location data is attached.
- Run Step 3 to assign grid connection points (GCPs) and apartments.
- Modify
buses.csvto create alternative scenarios:- Increase number of PV systems
- Increase heat pump penetration
- Increase EV adoption
- Run Step 4 to add time series data to the PyPSA grid.
- Time series can be modified directly in the PyPSA network.
- Run Step 5 to add further components and parameters.
- The grid can then be analyzed using PyPSA.
Frameworks used in this work:
- osmnx https://github.com/gboeing/osmnx
- pyPSA https://github.com/PyPSA/PyPSA
- pyCity https://github.com/RWTH-EBC/pyCity
Data used in this work:
- ding0 Networks: Amme, J., Dubielzig, P., & Schachler, B. (2023). Distribution grid data generated by ding0 (v0.3.0-alpha) [Data set]. Zenodo. https://doi.org/10.5281/zenodo.10405129
- OpenStreetMap; https://www.openstreetmap.org
- Zensus 2022 Data: © Statistisches Bundesamt (Destatis), 2025; https://www.destatis.de/DE/Themen/Gesellschaft-Umwelt/Bevoelkerung/Zensus2022/_inhalt.html#
- "mastr_values_per_plz.cs": Data from Marktstammdatenregister: ©2025 Bundesnetzagentur für Elektrizität, Gas, Telekommunikation, Post und Eisenbahnen; https://www.marktstammdatenregister.de/ that was internally postprocessed.
- "FZ Pkw mit Elektroantrieb Zulassungsbezirk_-8414538009745447927.geojson": Kraftfahrtbundesamt - Statistikportal: © Kraftfahrt-Bundesamt, Flensburg; https://das-kba-statistikportal.hub.arcgis.com/
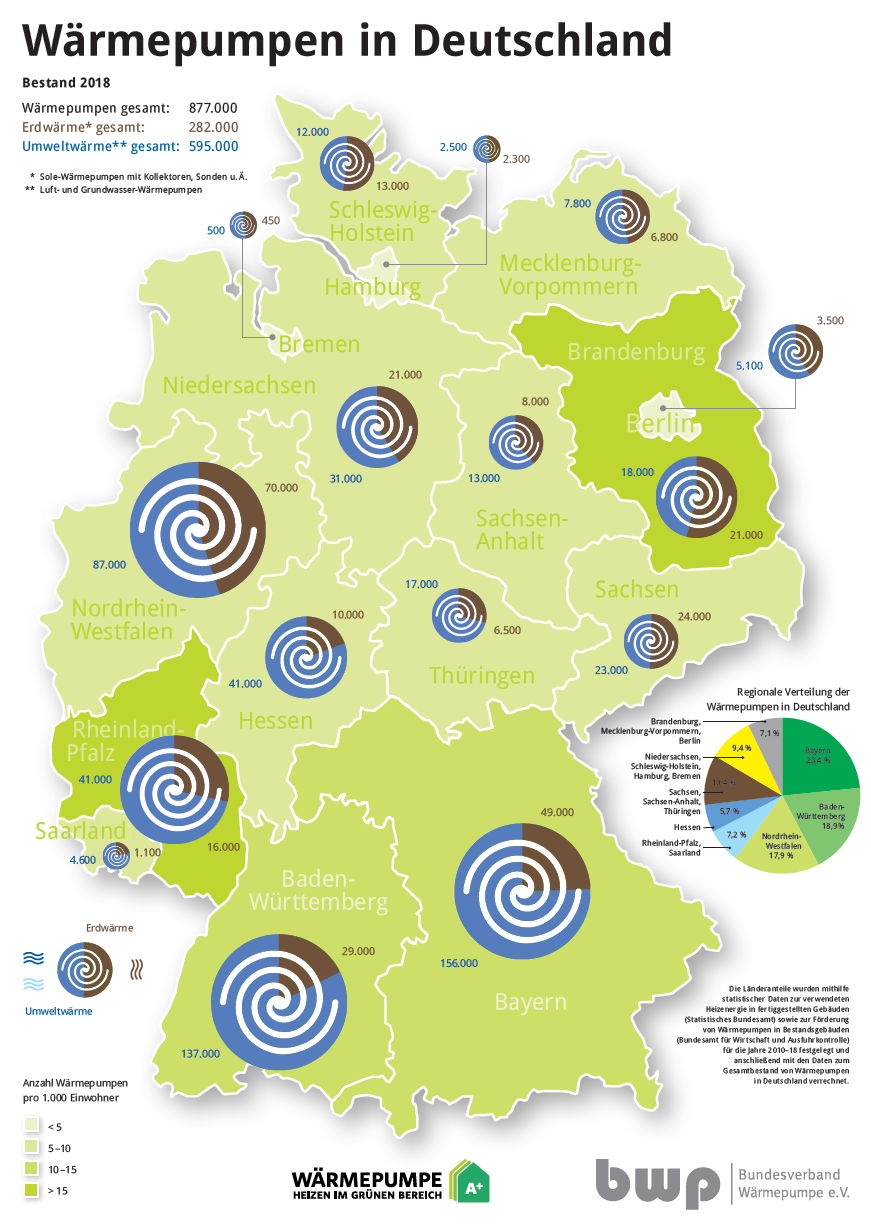
- Bundesverband Wärmepumpe (BWP) e.V. Wärmepumpen in Deutschland, 2018; https://www.waermepumpe.de/fileadmin/user_upload/Mediengalerie/Zahlen_und_Daten/Absatzzahlen_Marktanteile/619_WPinDeutschland_2018.PNG
- Climate data store: Era5 hourly data on single levels from 1940 to present; https://cds.climate.copernicus.eu/datasets/reanalysis-era5-single-levels?tab=download
- "georef-germany-postleitzahl.geojson": Postleitzahlen Deutschland; from https://www.govdata.de/suche/daten/deutschland-postleitzahlen under „Datenlizenz Deutschland – Namensnennung – Version 2.0" (https://www.govdata.de/dl-de/by-2-0)
This Repo is in work in progress and has not yet been thoroughly validated.