Mine Rehabilitation Intelligence for Western Australia's Iron Ore Industry
Live demo: https://rehabtrack-ivory.vercel.app
Across the four Pilbara sites in this system, $186 million in rehabilitation bonds are waiting to be released. The operators know their obligations. They are investing in the work. The problem is that rehabilitation unfolds across thousands of remote hectares, and the monitoring has not kept pace with the scale of the liability.
Quarterly ground inspections find problems after they have already set back the timeline. A rainfall erosion event, invasive weed encroachment spreading from a haul road, a replanting programme that is not establishing - these signals exist in the satellite data days after they occur. They appear in an inspection report weeks or months later, by which point the recovery trajectory has already shifted and the remediation cost has grown.
The bond release date moves. The next submission to the Department of Energy, Mines, Industry Regulation and Safety (DEMIRS) reflects a programme that is behind. And the capital stays locked up longer than it needs to.
Sentinel-2, operated by the European Space Agency, photographs the Pilbara at 10 metre resolution every five days. That imagery has been freely available for over a decade and contains a precise, repeatable record of vegetation health across every rehabilitation zone in the region.
RehabTrack processes that imagery against a five-year historical baseline to surface anomalies before they reach a quarterly report.
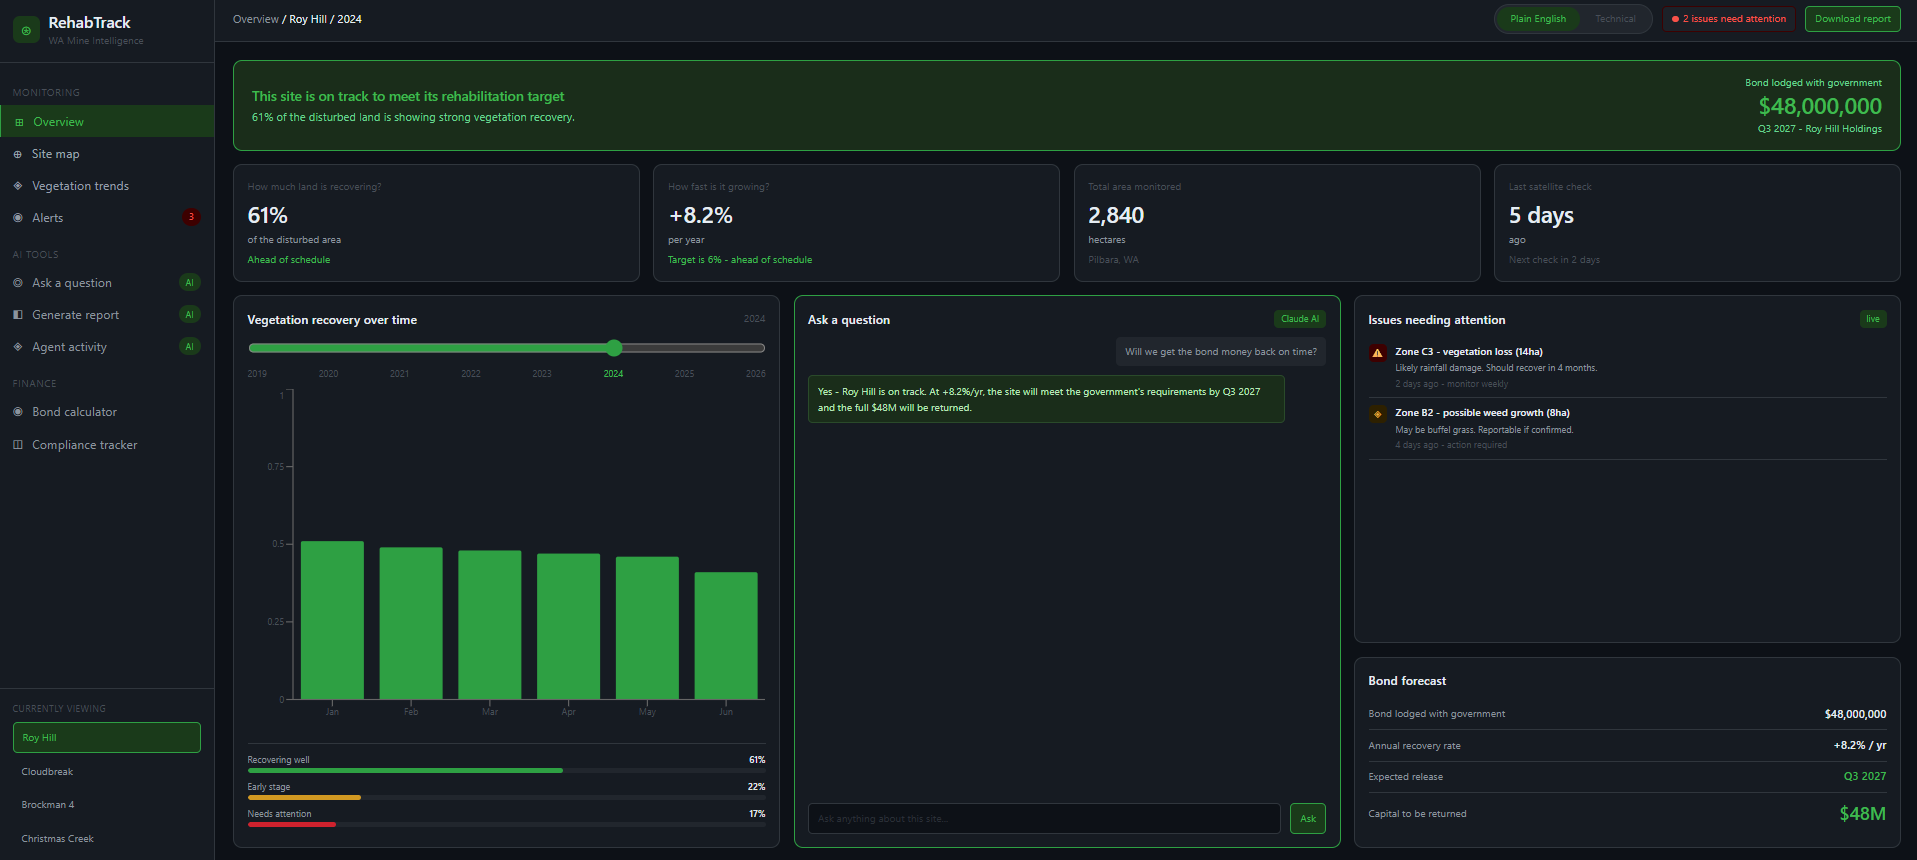
Across the four sites currently in the system:
Roy Hill, Zone C3. Vegetation health dropped sharply over 30 days following the June 2024 rainfall event. The satellite recorded the change two days after it occurred. A ground inspection would not have confirmed it for weeks.
Roy Hill, Zone B2. The vegetation pattern in this zone is inconsistent with native Pilbara regrowth. The signature matches buffel grass, a declared invasive weed. Under the Mine Closure Plan, this is a reportable event that must be resolved before bond release verification can proceed.
Christmas Creek, Zone E1. At the current recovery rate, this zone will not reach the government's release threshold until 2035. The bond release target for the site is 2030. That five-year gap represents a material risk to the $41 million bond.
Cloudbreak, Zone A1. This zone has reached the government's vegetation milestone and the $62 million bond is on track for release in Q1 2027.
These are readings from actual satellite passes. Not projections.
The financing cost of delay is measurable. A $48 million bond at standard financing rates represents roughly $2.4 million per year in tied-up capital. Identifying a problem six weeks earlier than a ground inspection, and treating it before it spreads, directly compresses that timeline. The Scenario Planner quantifies the financial impact of each intervention option before any budget is committed.
Continuous records strengthen the regulatory position. DEMIRS assesses rehabilitation progress at each triennial Mine Closure Plan review. A system that produces an auditable, continuous record of zone-level vegetation recovery is a stronger basis for that submission than one assembled from periodic site visits.
The same data, presented differently for each audience. A Chief Financial Officer, a rehabilitation scientist, and a regulator each need the same underlying information presented in entirely different ways. RehabTrack generates an Executive version and a technical Analyst version simultaneously from the same data. No analyst spends days reformatting the same numbers for three different audiences.
Financial modelling before committing to an intervention. Before approving a replanting programme costing $400,000 to $800,000, a site manager can model the projected bond release date, months recovered, and net financial benefit against the cost, across multiple rainfall scenarios. That analysis is available in seconds.
Environmental consultancies and specialist monitoring platforms such as Stantec, Satsense, and Decipher deliver satellite data and vegetation analysis as a professional service. A specialist interprets the data, prepares a report, and delivers findings on a schedule. That model is well established and valuable.
Its limitation is structural. The insight is only as current as the last report, and it is only as useful as the person reading it is equipped to act on it. A board member reviewing a quarterly summary, or a financial controller approving a rehabilitation budget, cannot readily assess whether a programme is tracking to plan from a PDF appendix.
RehabTrack is not a replacement for expert environmental assessment. It is a layer that makes the underlying data accessible to the people who control the capital and make the decisions, in real time and without a specialist intermediary.
A Chief Executive, a board member, an investor, or a regulator can open the dashboard and immediately understand the status of four active rehabilitation programmes, the financial exposure behind each one, the issues requiring action, and the projected outcomes under different scenarios.
The satellite data has always existed. The analytical methods have always existed. The gap has been between that data and the people whose decisions it should be informing.
Satellite monitoring. Vegetation health scores across all zones from January 2019 to June 2026. Anomaly detection against a five-year historical baseline. Zone-level breakdowns per site with notable event overlays.
AI anomaly detection pipeline. Three agents run in sequence against real NDVI time-series data. The Watcher computes seasonal Z-scores per zone by comparing the latest satellite reading against the same month across the previous six years, and flags any zone that deviates significantly from its historical baseline. The Analyst classifies each flagged zone by cause and severity using rule-based logic covering vegetation failure, slow recovery velocity, and severe seasonal decline, and identifies the regulatory obligation under the Mine Closure Plan. The Reporter logs the findings, updates the bond release forecast, and surfaces alerts to the dashboard. This is real anomaly detection running against real data, not a simulation.
Ask a question. Conversational AI powered by Claude (Anthropic). Ask anything about the selected site in Executive mode for plain-English answers or Analyst mode for technical responses with vegetation index values and zone-level data. Restricted to mine rehabilitation topics only. Ask about the sources behind any answer and the AI will explain what data it is drawing from.
Generate report. Four distinct report types generated simultaneously in Executive and Analyst versions: a formal compliance summary for DEMIRS, an investor update for shareholders and board members, an executive briefing with bullet key findings for senior management, and a technical report for environmental scientists. Switch between versions instantly. Download as PDF.
Scenario planner. Model any intervention decision against any external condition in Executive or Analyst mode. Executive mode gives plain-English financial outcomes. Analyst mode gives technical outputs with vegetation health scores and recovery velocity figures. Both use bullet point structure for clarity.
Bond calculator. Interactive financial model per site. Current and downside recovery scenarios. Updates automatically when switching sites.
Compliance tracker. Portfolio view of all four sites and $186 million in bonds. Recovery rate versus regulatory target, active alerts, and bond release status per site. Portfolio-level compliance report structured for a board of directors, opening with a portfolio verdict and closing with numbered board actions. CSV export.
Interactive site map. Zone boundaries per site with three view modes: recovery status, satellite imagery, and year-on-year change.
Full light and dark mode.
The agent pipeline uses seasonal Z-score analysis, which is the standard approach in operational vegetation monitoring systems. The method works as follows:
For each monitored zone, the Watcher takes the most recent vegetation health reading and compares it against the same calendar month across all previous years in the dataset. It computes the mean and standard deviation of those historical same-month readings to build a seasonal baseline. The Z-score is then calculated as the deviation of the current reading from that baseline, expressed in units of standard deviation.
A Z-score below -1.5 indicates the zone is meaningfully lower than expected for this time of year, accounting for natural seasonal variation. A score below -2.5 indicates a severe decline. The Analyst then classifies the cause using three failure modes: critical vegetation failure (current health score below 0.10), slow recovery velocity (annual recovery rate below 2%), and severe seasonal decline (Z-score below -2.5).
This approach is more reliable than a simple threshold check because it accounts for the fact that vegetation health naturally varies by season. A reading that looks low in winter may be entirely normal. Comparing against the same month in previous years isolates genuine anomalies from expected seasonal patterns.
In a production system, this pipeline would run automatically every five days triggered by each new Sentinel-2 satellite pass. The current implementation runs against the static NDVI dataset exported from Google Earth Engine. Live satellite ingestion and email delivery would require a Google Earth Engine service account and an email service integration.
Why seasonal Z-score rather than a fixed threshold? Vegetation health naturally varies by season. A fixed threshold would generate false alerts in winter and miss genuine problems in summer. Comparing each reading against the same month in previous years isolates real anomalies from expected seasonal variation. This is the approach used in operational monitoring systems including those used for food security early warning at continental scale.
Why rule-based classification in the Analyst rather than a machine learning model? The dataset has seven years of monthly readings across a small number of zones. That is not enough labelled data to train a reliable classifier. Rule-based logic with interpretable thresholds is more appropriate at this data scale, easier to audit, and produces outputs that can be explained to a regulator. A machine learning approach becomes appropriate once ground-truth labels are available across multiple seasons and sites.
Why four distinct report types with separate prompts? A compliance summary for DEMIRS has a completely different structure, tone, and regulatory framing than an investor update for a board. Using the same prompt with a label change produces output that sounds like one but looks like the other. Each report type has its own prompt that specifies the audience, the section structure, the language register, and what to include and exclude.
Why a guardrail on the Ask AI page? Without topic restriction, the conversational AI becomes a generic chatbot that happens to know about mine rehabilitation. The guardrail restricts Claude to rehabilitation and regulatory topics only. Attempts to bypass it via prompt injection or claimed permissions are explicitly addressed in the system prompt.
Why parallel API calls for report generation? Generating the Executive and Analyst versions sequentially would take twice as long. Both are generated simultaneously via parallel fetch calls and cached on the client. Switching between versions is instant with no additional API cost.
React 19, Vite, Tailwind CSS, React Router, Recharts, Leaflet, Claude API (Anthropic), Vercel serverless functions, Google Earth Engine, Python, Pandas
git clone https://github.com/Dev4221/rehabtrack
cd rehabtrack
npm install
Create .env in the root directory:
VITE_ANTHROPIC_API_KEY=your_key_here
Start the local API proxy (required for AI features when running locally):
node server.jsStart the application:
npm run devAI features on Vercel route through a serverless function automatically. No local proxy required.
MIT