The number of contacts and the social behavior of the population is very important in shaping pandemic waves. During the SARS-CoV-2 pandemic 2020-2022 many approaches tried to leverage mobility data from mobile phone operators (aggregated cell information from cell phone users) to understand the spatio-temporal spread of the virus. While spreading from region to region may be described well with mobility data, the attempts to predict local spread and reproducton numbers remained futile. This can be understood from the failure of mobility data to cover "two-point" correlations of pairs of humans being in close range from each other. On the other hand, traces of behavior that are realted to contacts, such as communting to work places, are still contained in the mobility data. Here I tried to connect mobility data with explicit knowledge of contact number from a German study of GPS-acurate individual cell phone traces. It turns out that the mobility data can be used to predict contact numbers for Germany using a machine-learning model. Interestingly, the method works much better with Google and Apple mobility data combined than with either one only. I then use the trained model to predict the contact index for each country where the mobility data is availible. The contact index is then compared to the government response index and the reproduction numbers for each country.
This is a first description of Contact Index calculations based on mobility data. I used the Google and Apple mobility data that was publicaly availible together with the German Contact Index that can be found here:
https://contactindex.netcheck.de
- With XGBoost I first calculated a fit of the German mobility data to the German CX:
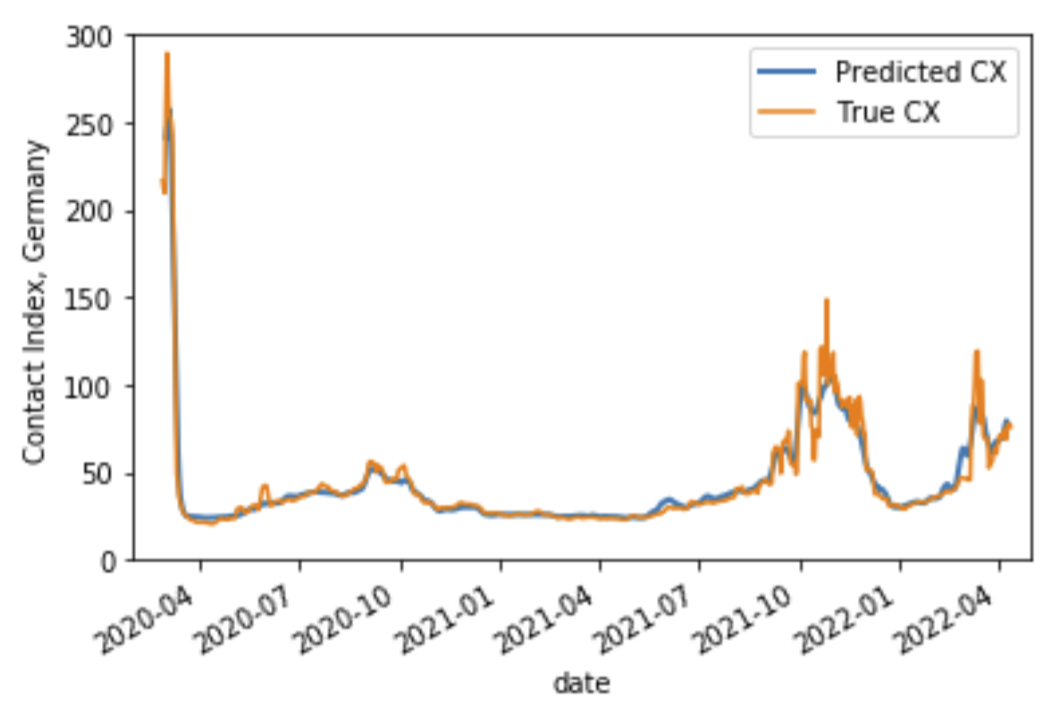
- Overfitting is avoided by using k-fold cross-validation.
- Then I use the resulting model to predict the Contact Index for other countries from their respective mobility data.
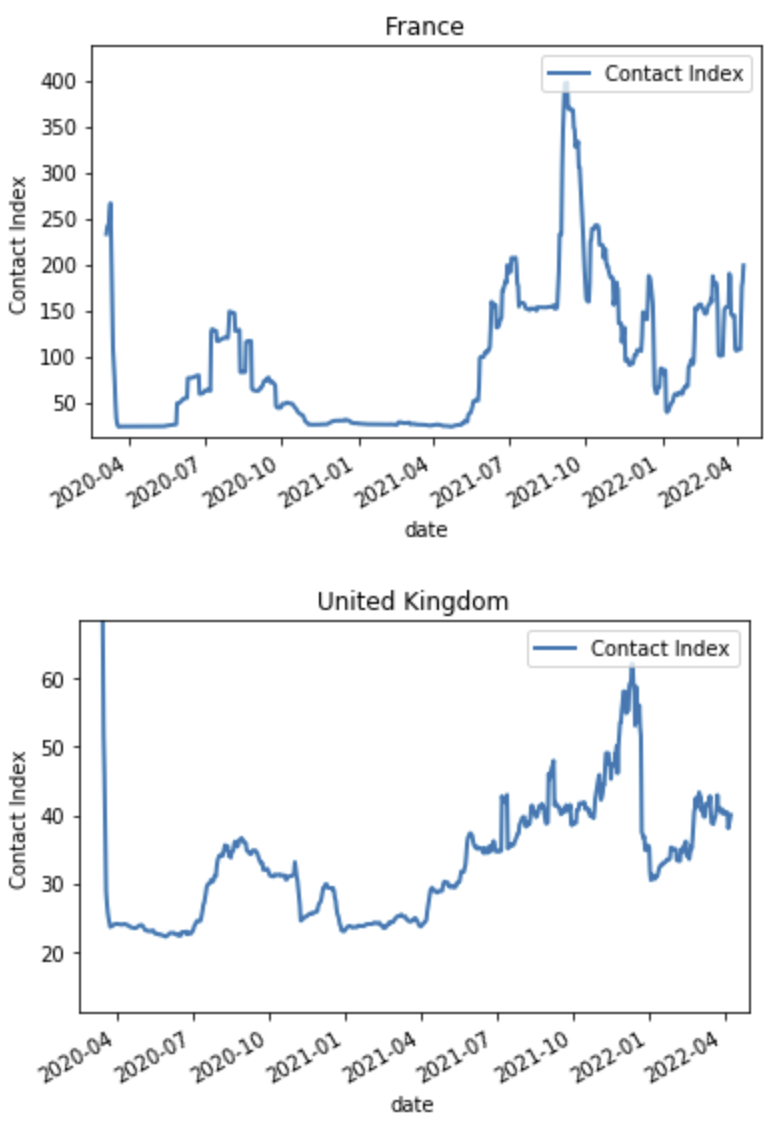
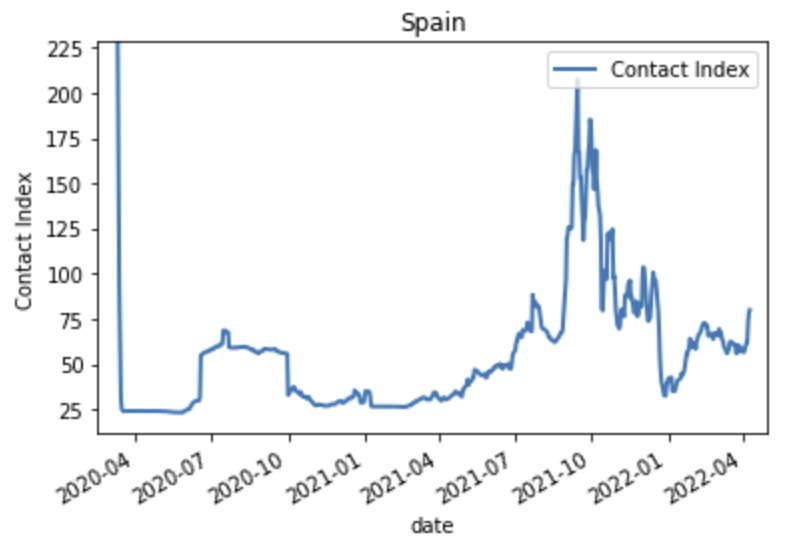
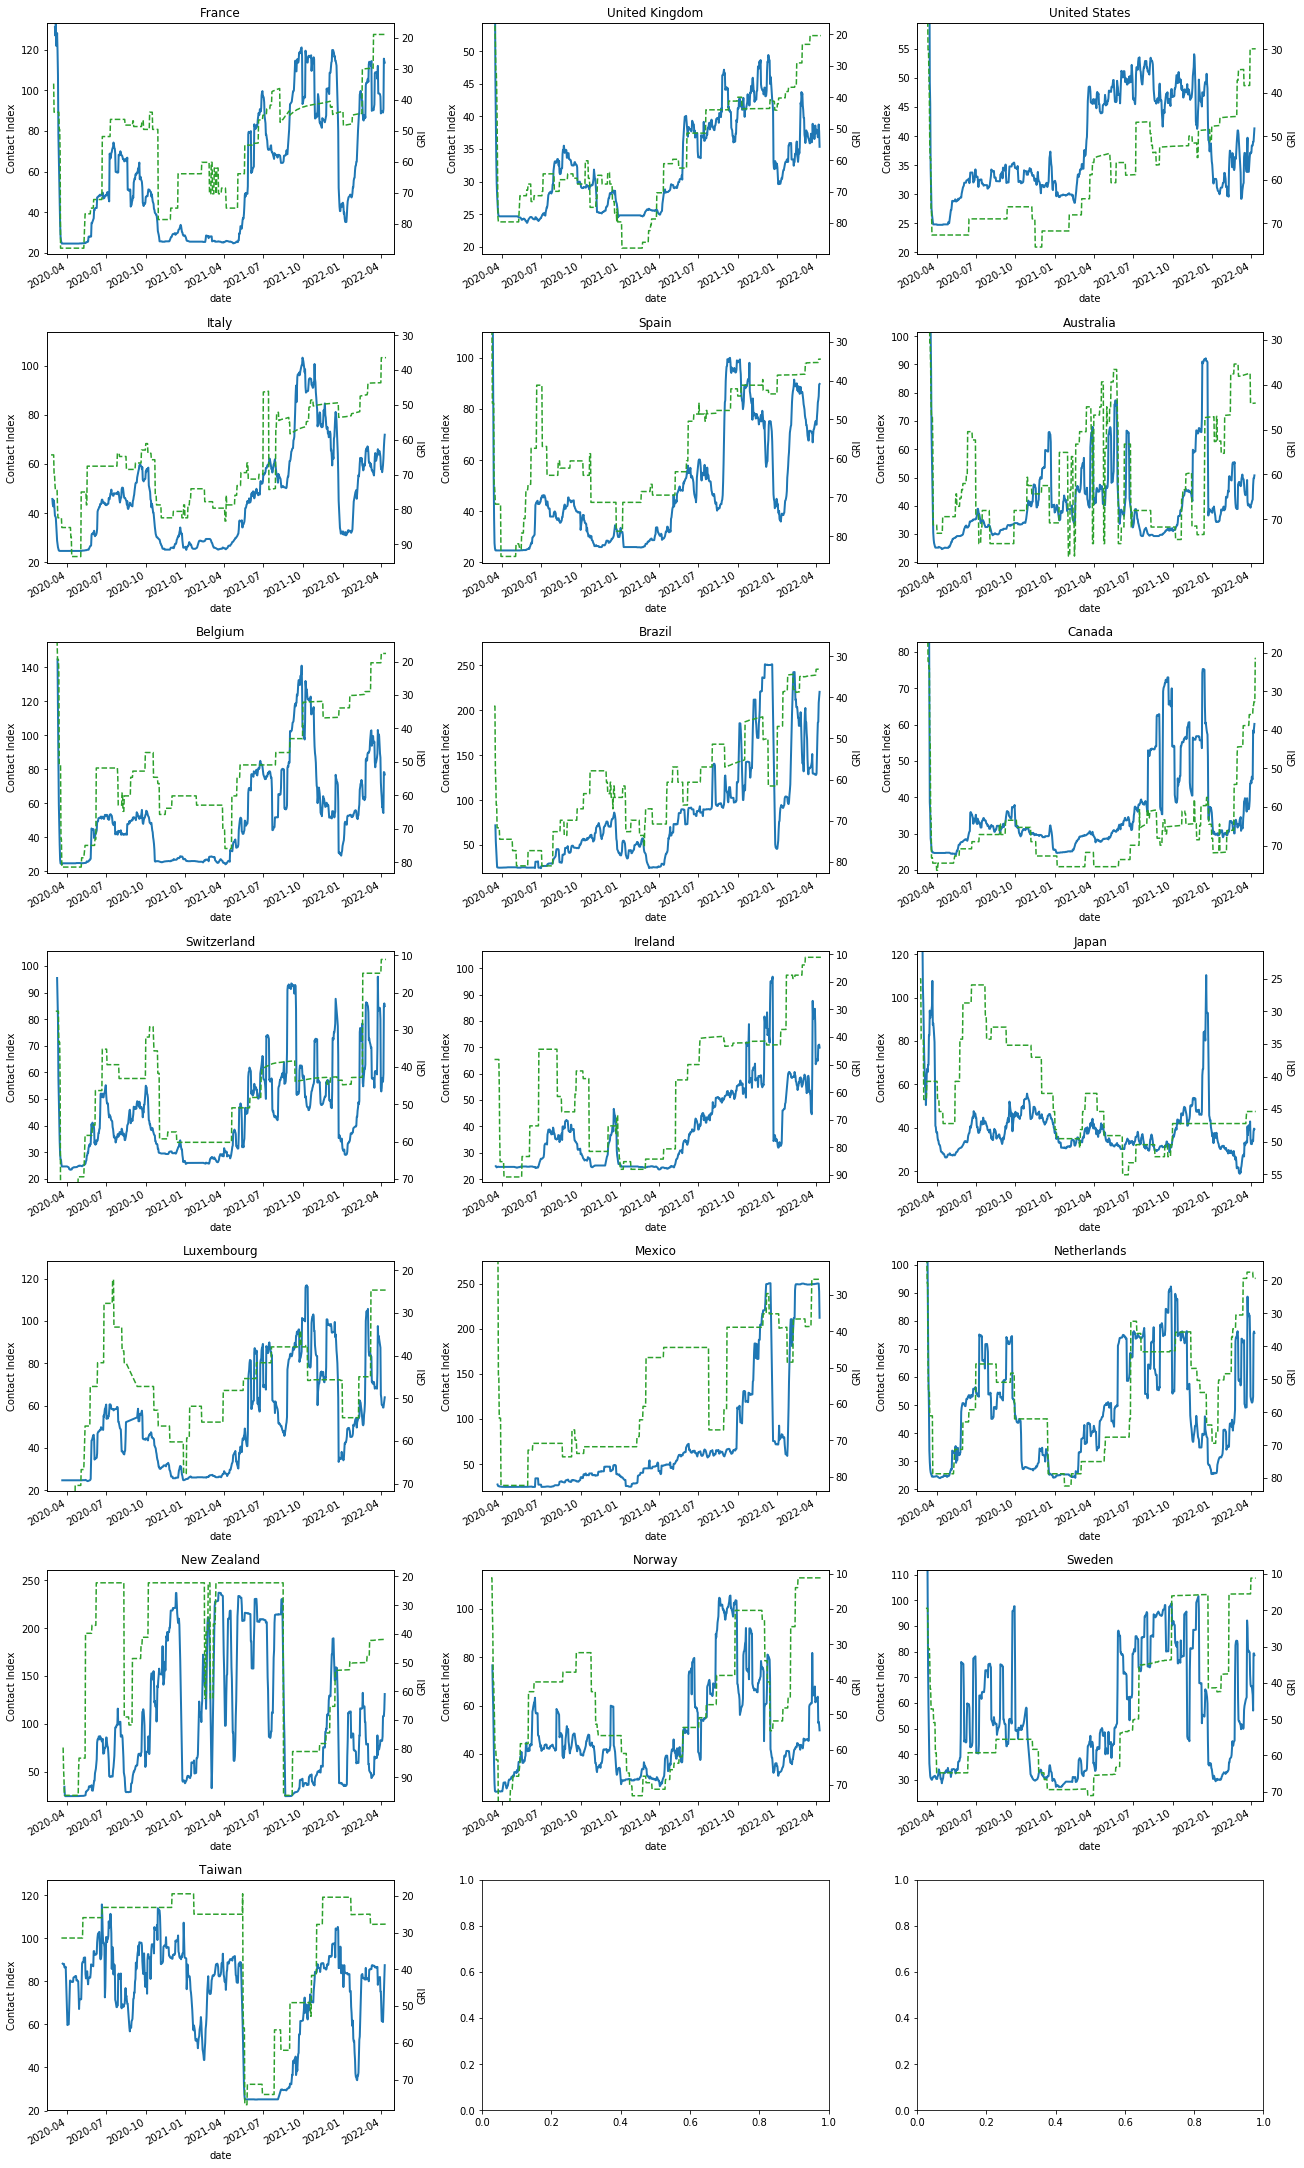
Below are some preview charts for selected countries.
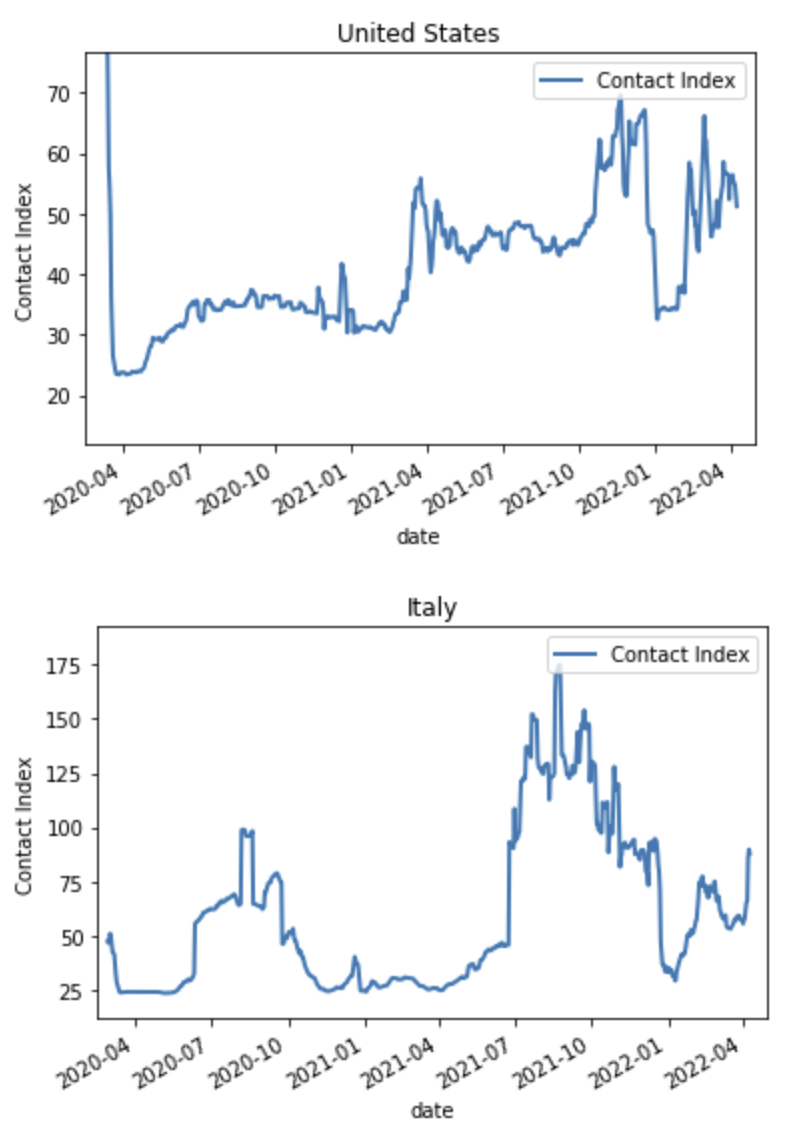
- The first columns shows the evolution of CX over the entire time for which mobility data is availible (Apple stopped providing in April 2022).
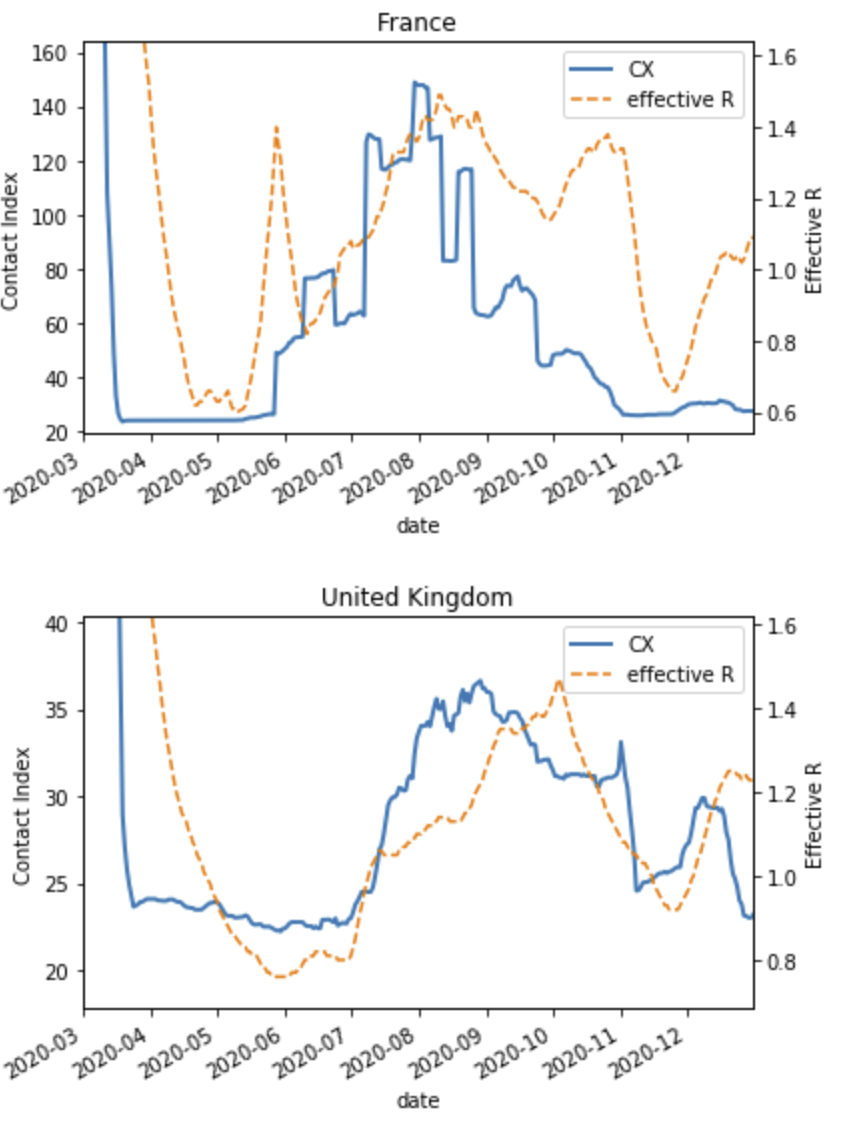
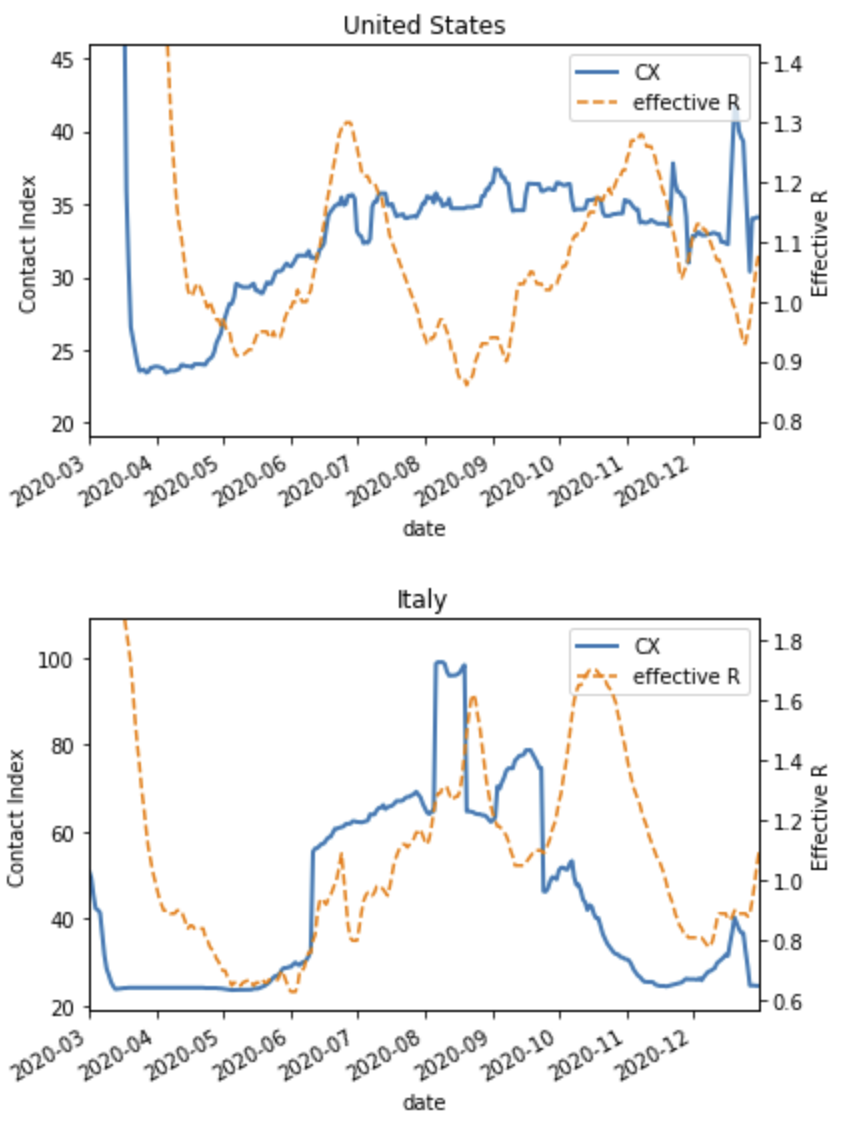
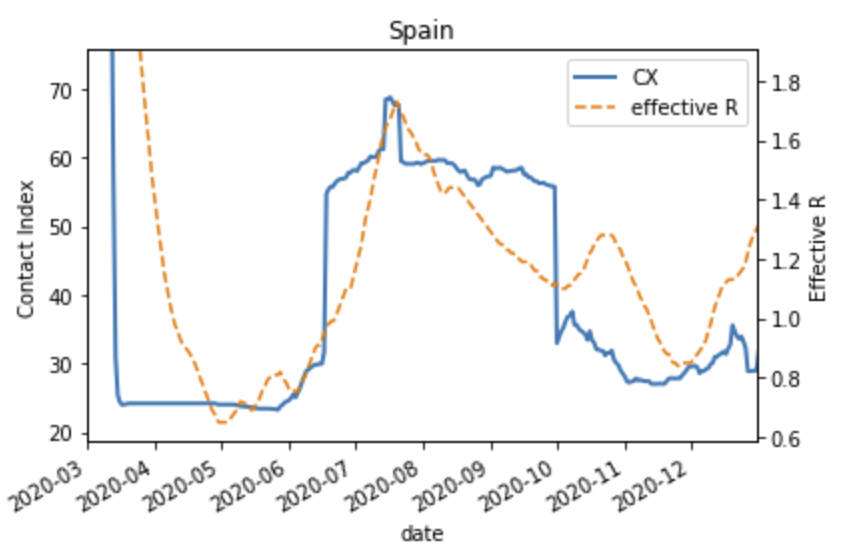
- The second column compares the CX evolution during the first year of the pandemic with that of the R values for the respective countries. Mostly good agreement (with the expected time delay for reporting) except for United States.
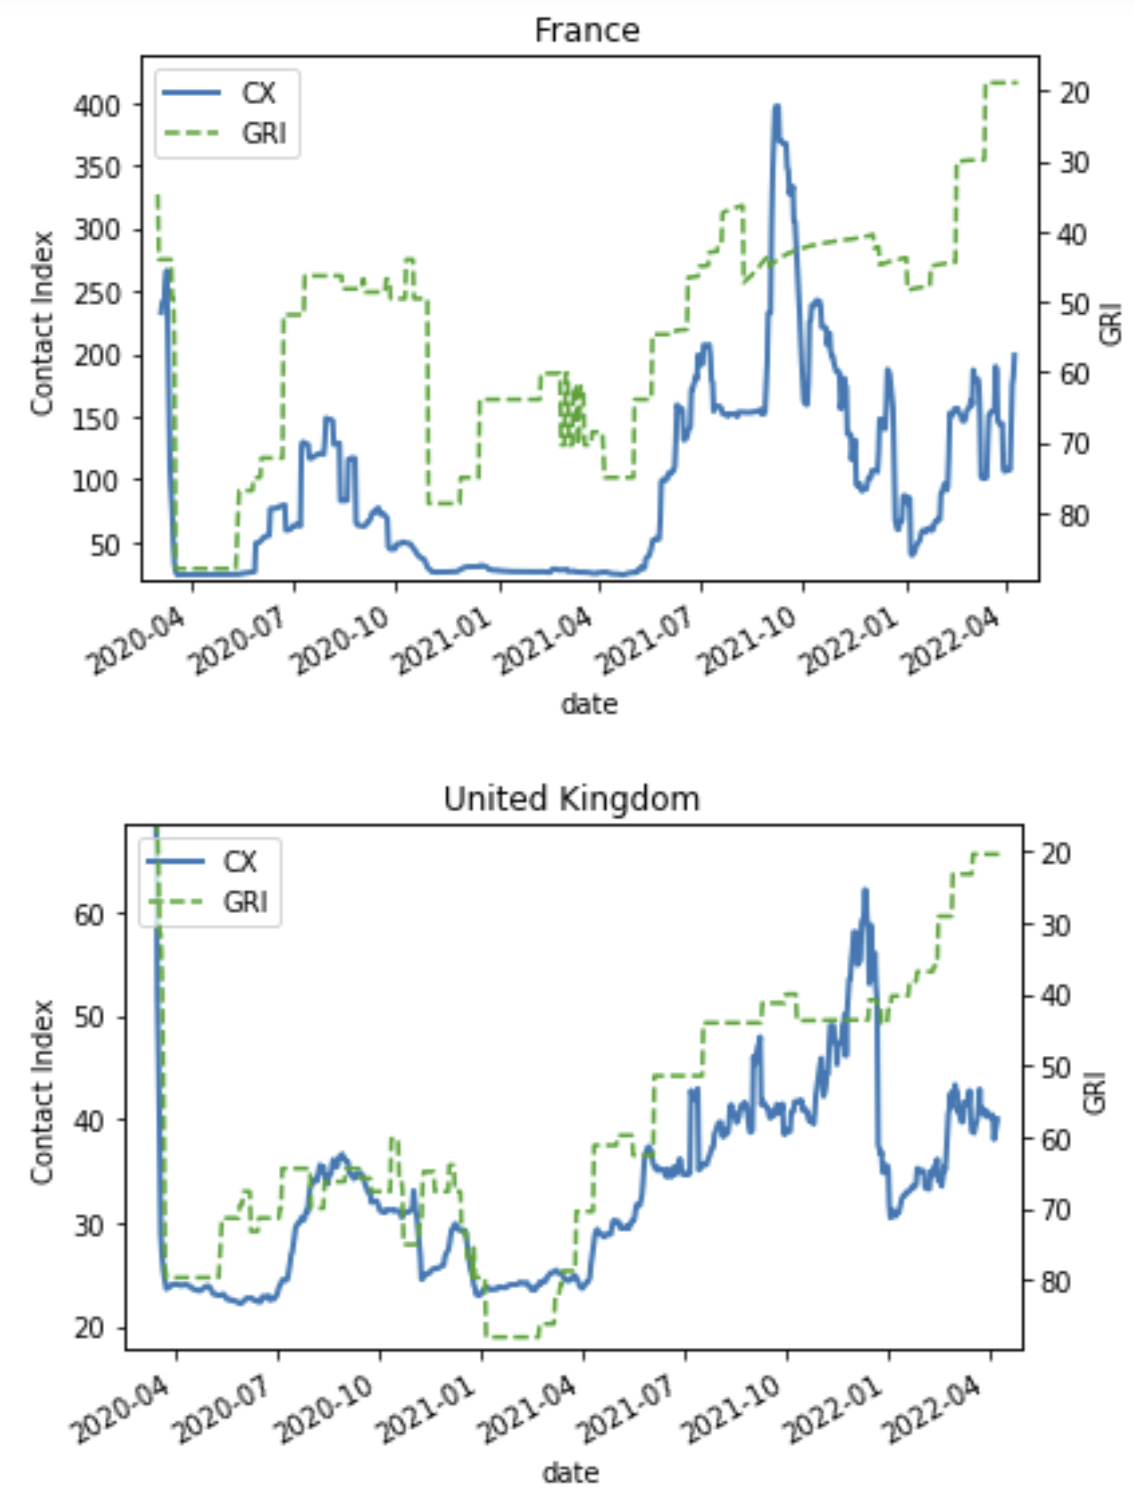
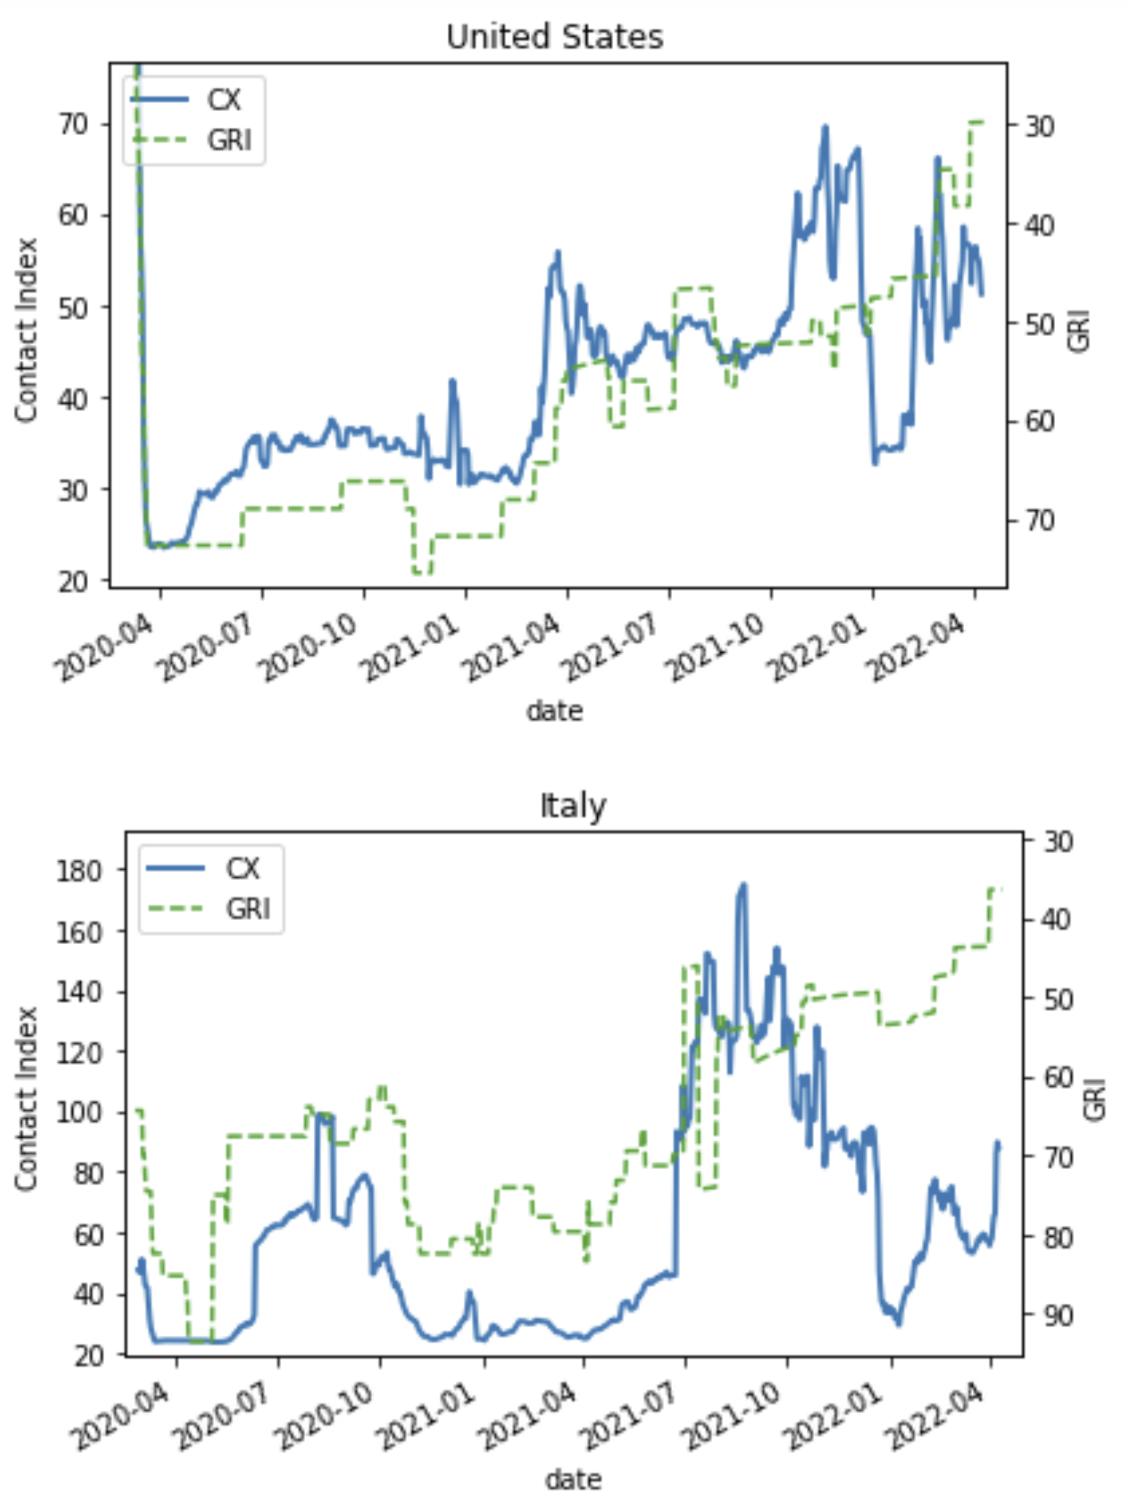
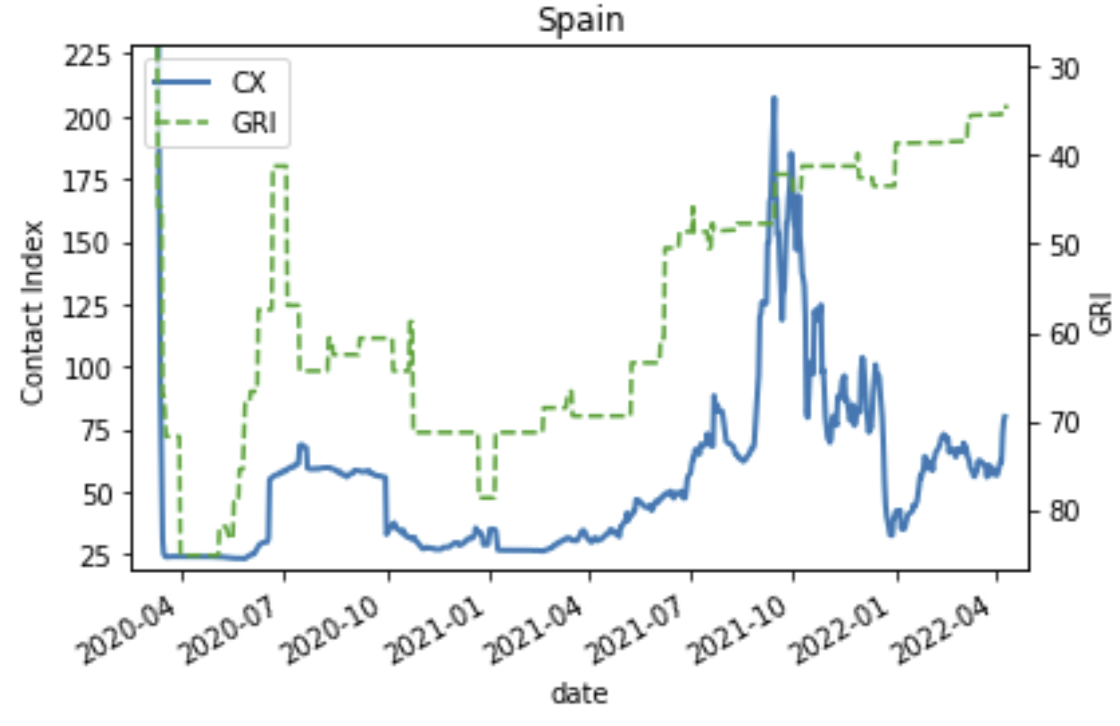
- The third column compares CX with the Government Response Index (specifically the stringency index, which includes all containment and closure policy and one health information index). Note that the axis if GRI is inverted so that strong restrictions coincide with small CX. Data from https://github.com/OxCGRT/covid-policy-tracker
Next we plot data for all countries for which complete information is available (why is much information in Apple mobility data missing in many countries?):
We then calculate the correlation coefficients for optimal time delay between CX and R (shown on the rhs) for all available countries and obtain:
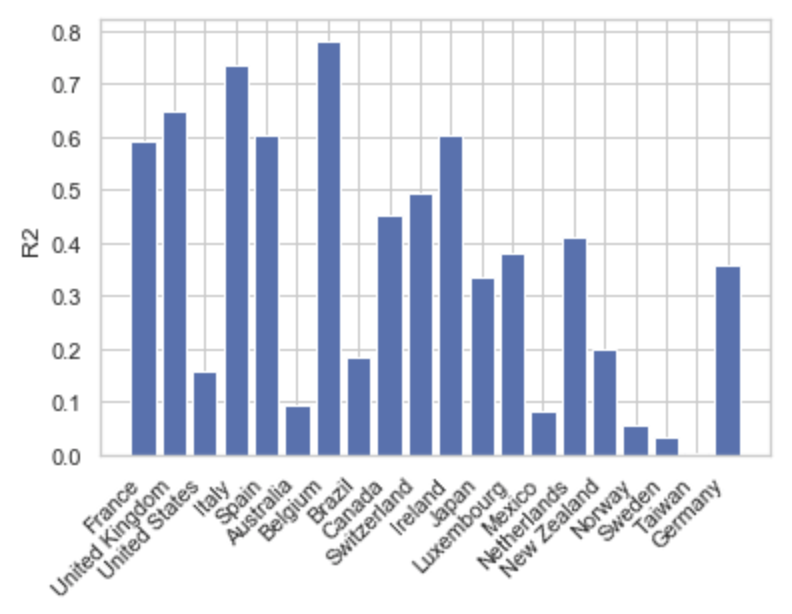
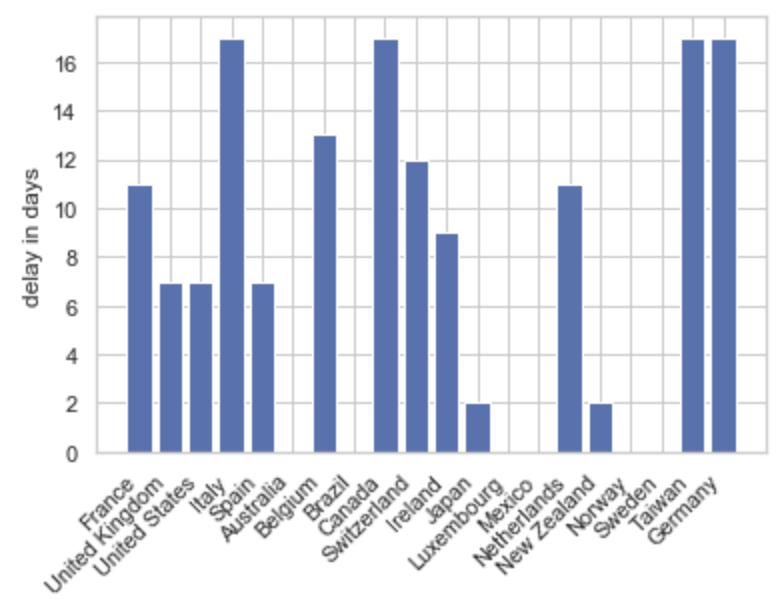
Apparently for most European countries (except Sweden and Norway) a very convincing correlation between the estimated CX and the reproduction numbers is found. For other countries the R2 is much smaller. We interpret this as a too small prediction power of the mobility data (fitted to German contacts) for those countries, possibly because the mobility and transport behavior is very different from the central European countries.
We will continue further analysis with those countries which have an R2 value above 0.5: France, UK, Italy, Germany, Spain, Belgium, and Ireland.
Transmissibility T is the probablity of transmission of the virus given the contact between and infected and an susceptible individdum. I have here used a scaled version of T, so that the value for wildtyp SC2 in a completely non-immune population is 1. Please find more information on the definition in https://www.medrxiv.org/content/10.1101/2023.03.02.23286502v1
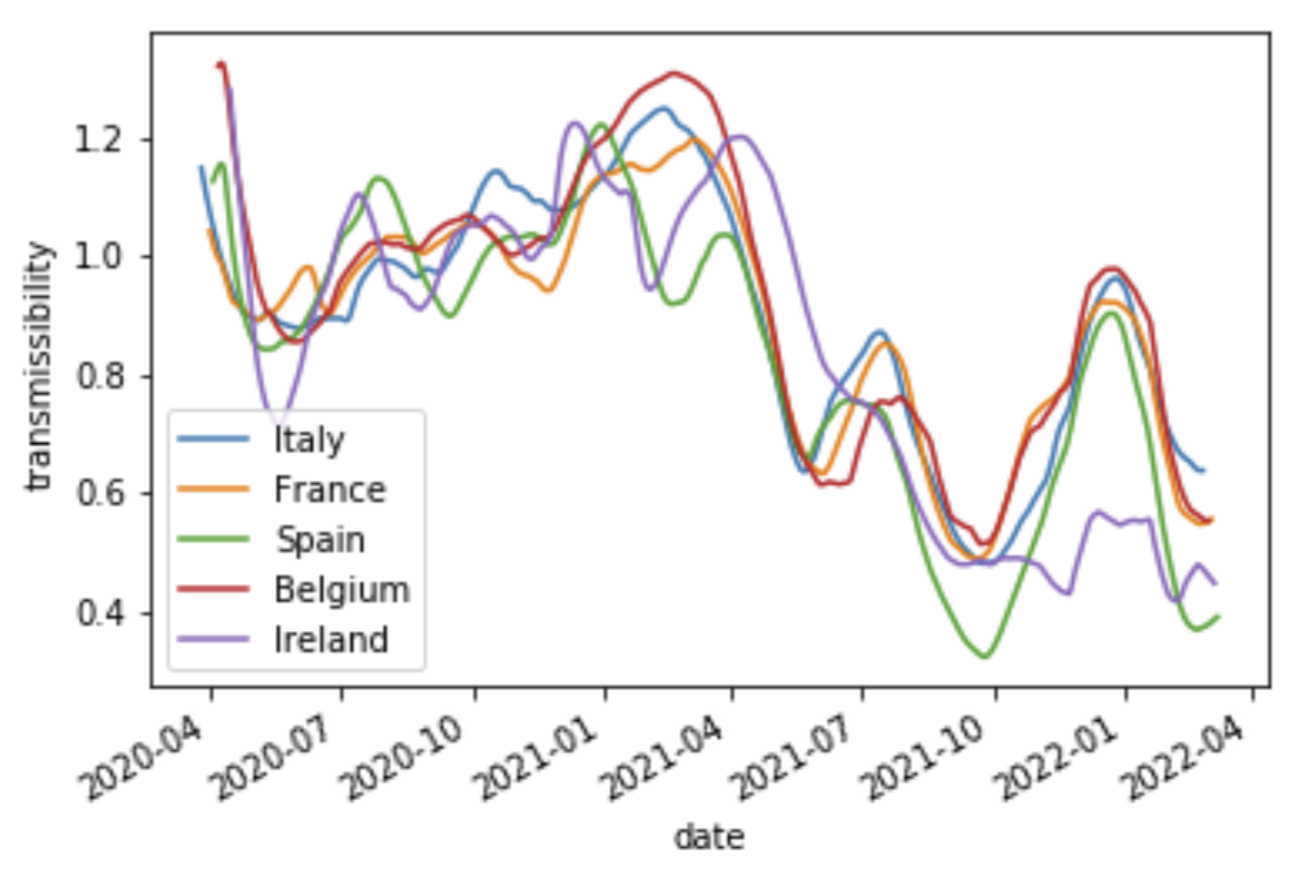
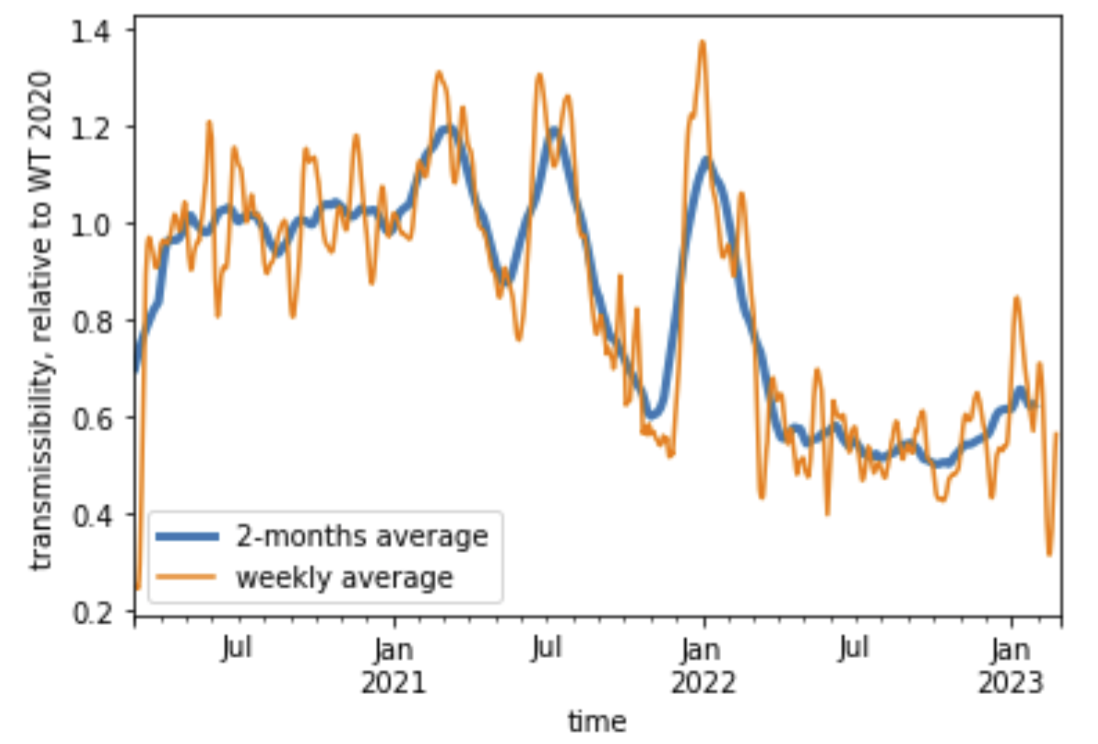
As in the case of Germany (rhs), we can see for most countries the T increasing effects of alpha, delta and omicron variants. As well, immunization (natural and vaccinated) drives down T from early 2021 on.
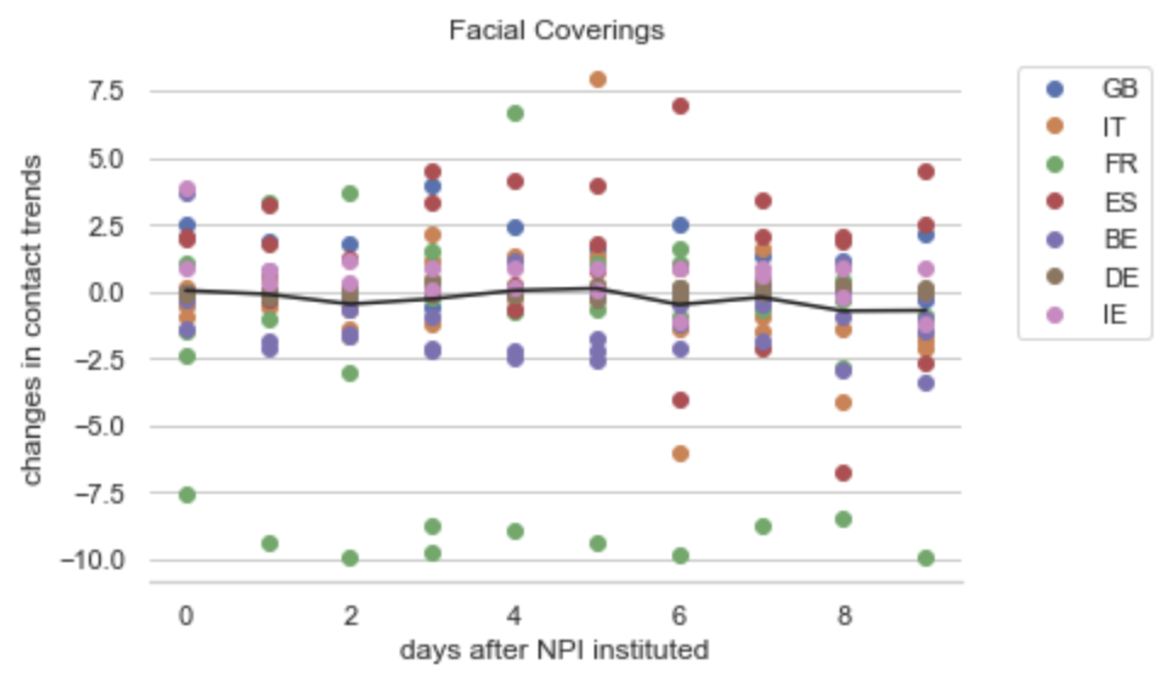
What does it mean for the assessment of NPIs during the SC2 pandemic? Ideally, after implementation of an NPI, the number of contacts should reduce. However, there are a few conceptual problems:
A - The contact numbers are reduced because of self-restriction, often following the news of increased case numbers.
B - Contact numbers could also be reduced after announcement of the NPI.
In fact, we generally found that CX decreased often before the NPI implementation, so how should the NPI efficacy be judged? Therefore instead I consider the trend, or difference, in CX, and not the absolute value. So the question is then whether the NPI implementation does have any effect on the 'velocity' with which the contacts were reduced?
Here is the evolution of the weekly CX trends compared to their repsective values four days before the NPI implementation:
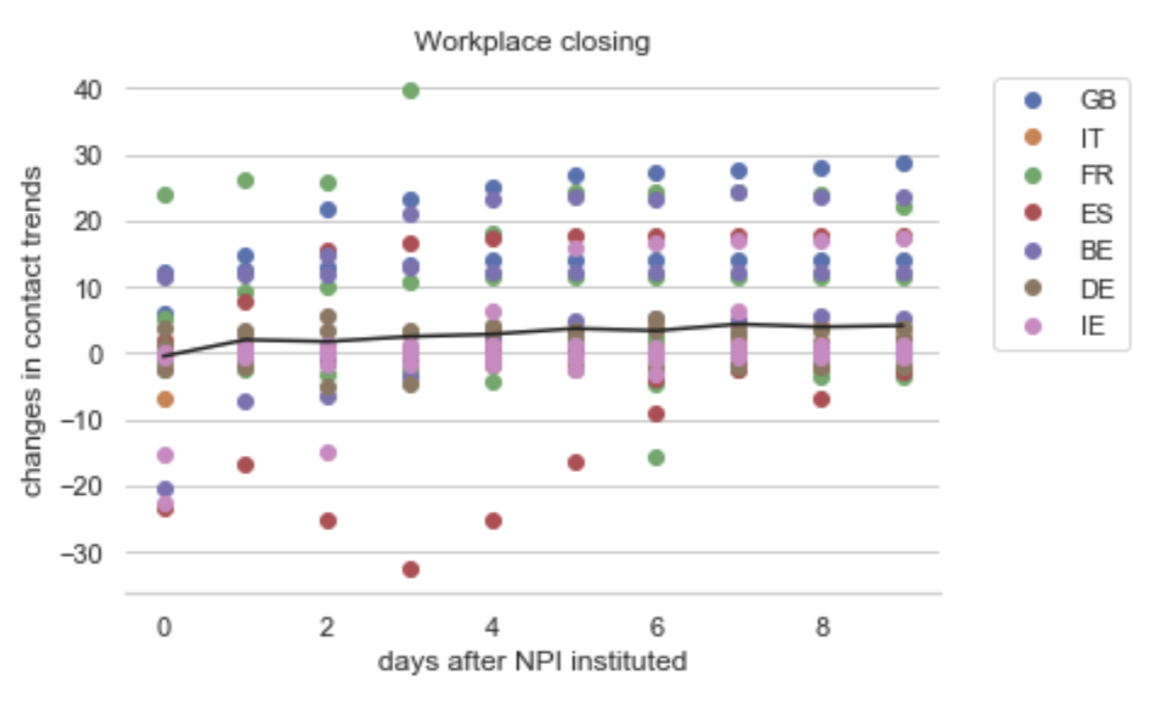
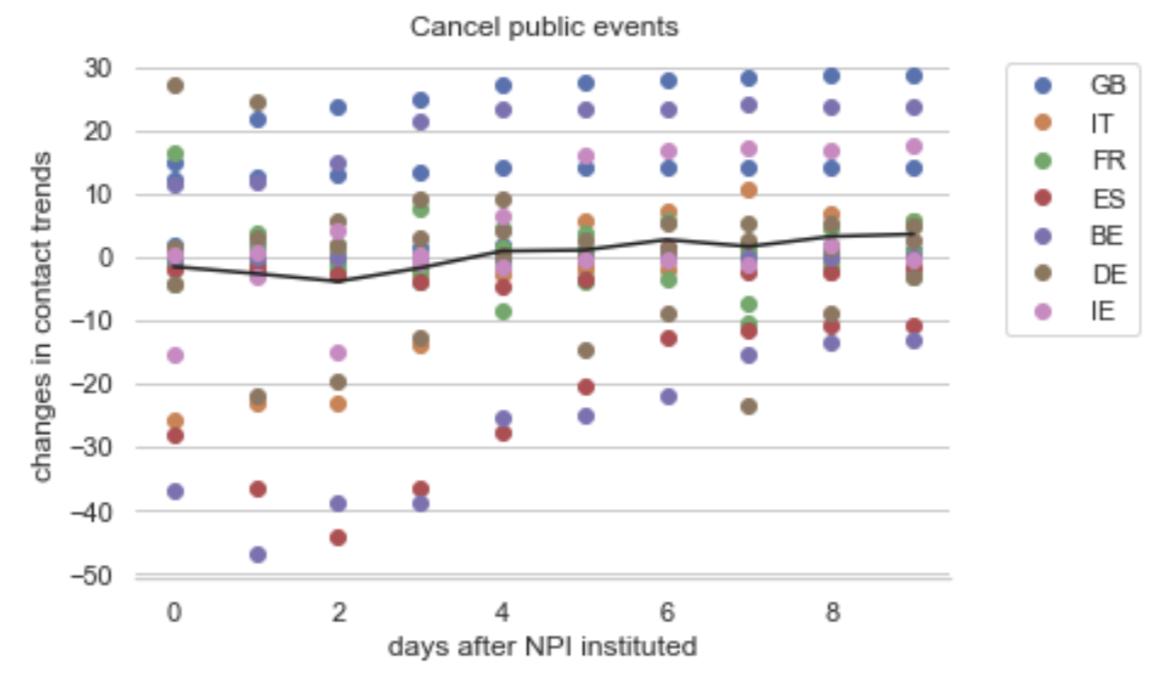
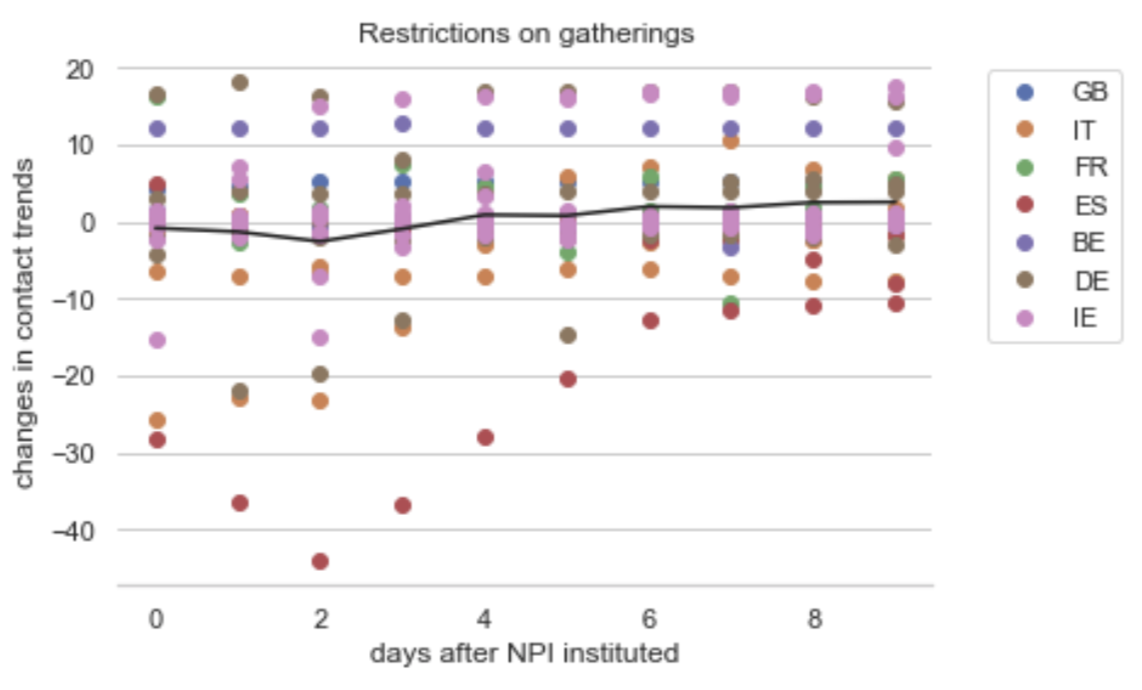
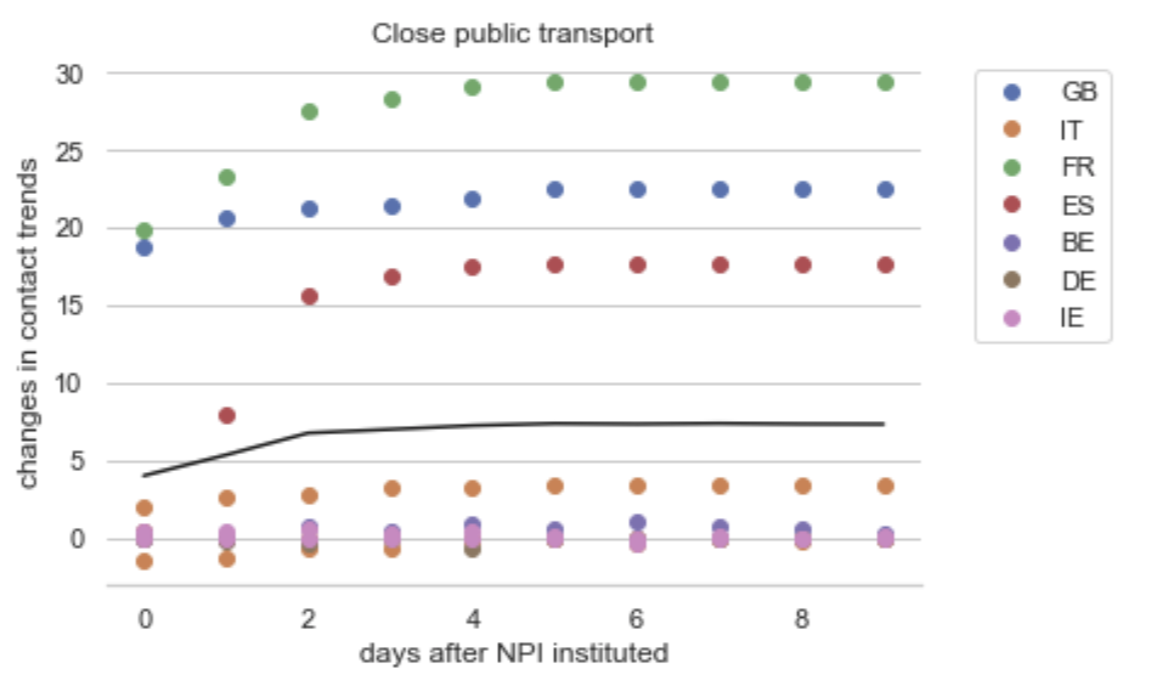
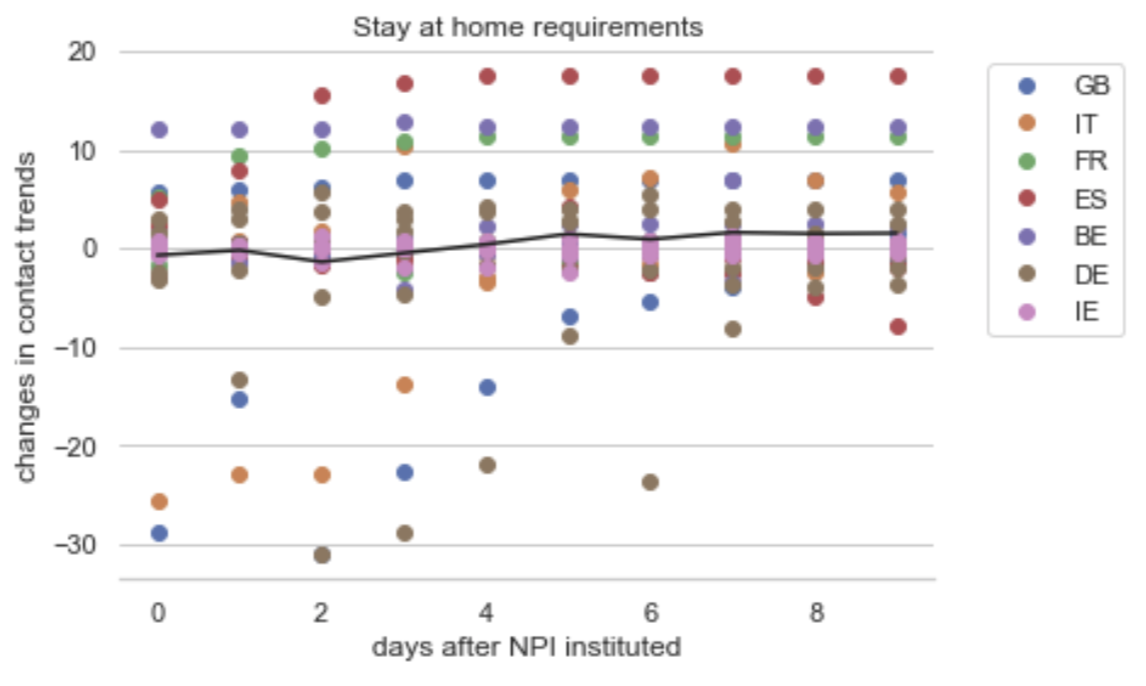
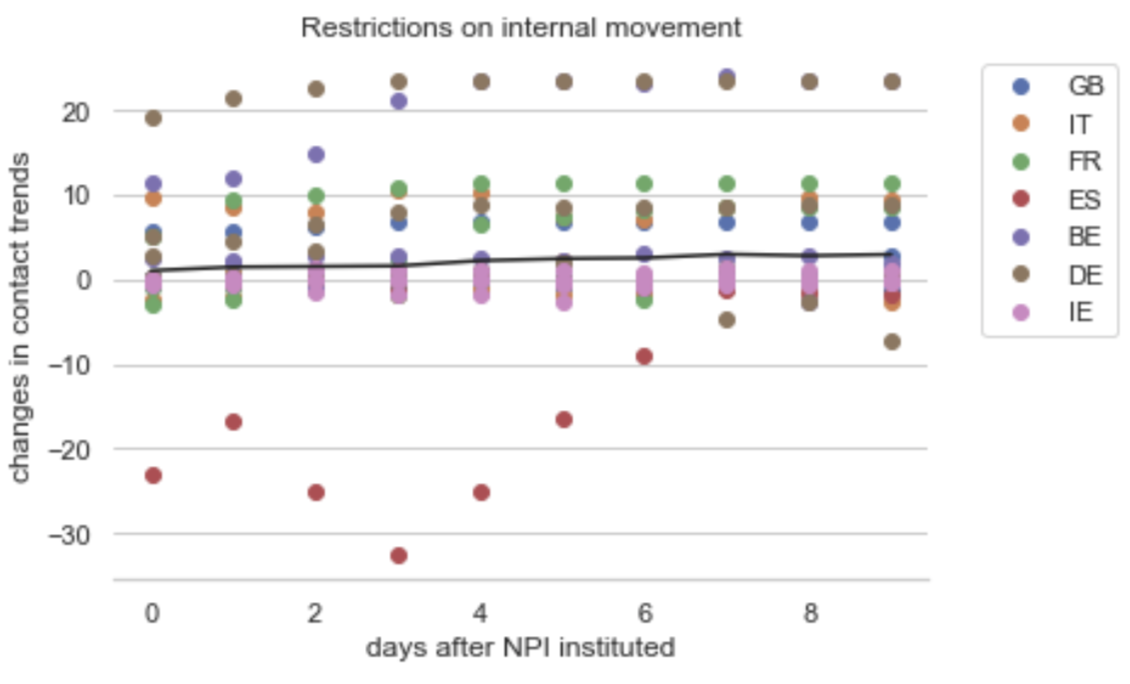
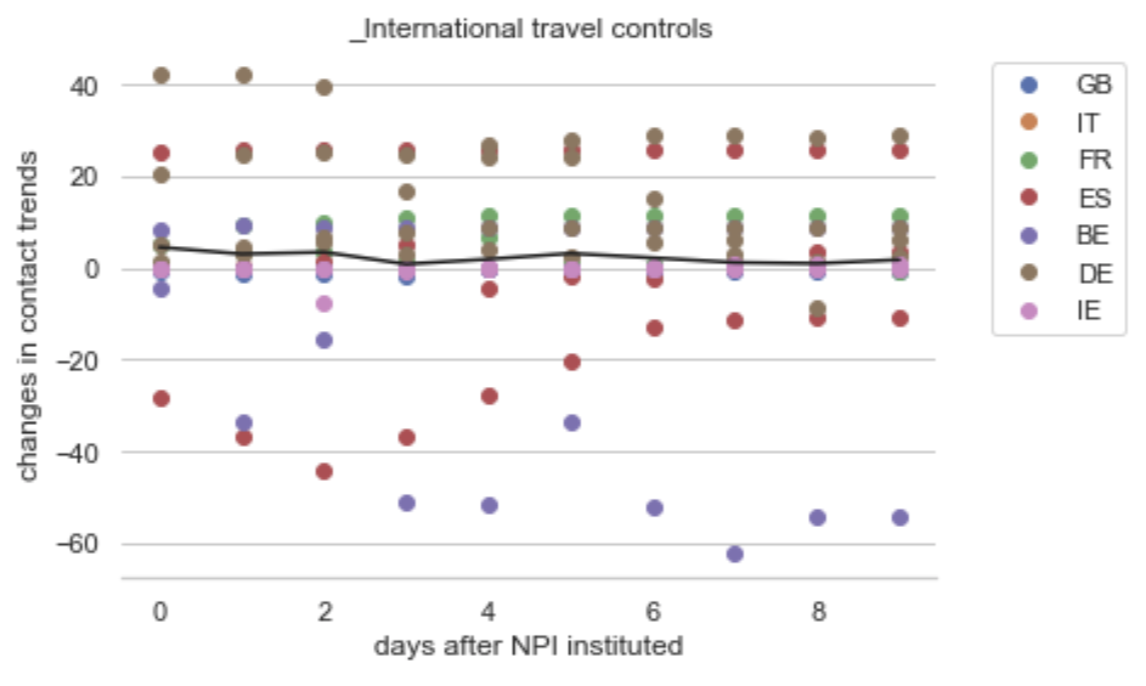
(work in progress)