Basic example:
import mplpub
import matplotlib.pyplot as plt

fig = plt.figure()
ax = fig.add_subplot(111)

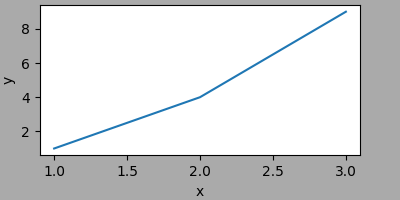
ax.plot([1, 2, 3], [1, 4, 9])
ax.set_xlabel('x')
ax.set_ylabel('y')

fig.set_size_inches(4, 2)

# un-comment to screw up mplpub.tight_layout:
# fig.tight_layout()

mplpub.tight_layout(ax)
fig.savefig('plot.png', facecolor='#aaaaaa')
Good version:
Bad version (called after fig.tight_layout()):
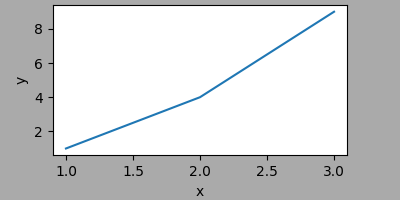
Might be a matplotlib issue. Issue is essentially calling tight_layout multiple times with different pad values makes the second adjustment inaccurate. May be resolved by using subplots_adjust directly as needed for #2.
Basic example:
Good version:
Bad version (called after
fig.tight_layout()):Might be a matplotlib issue. Issue is essentially calling
tight_layoutmultiple times with differentpadvalues makes the second adjustment inaccurate. May be resolved by usingsubplots_adjustdirectly as needed for #2.