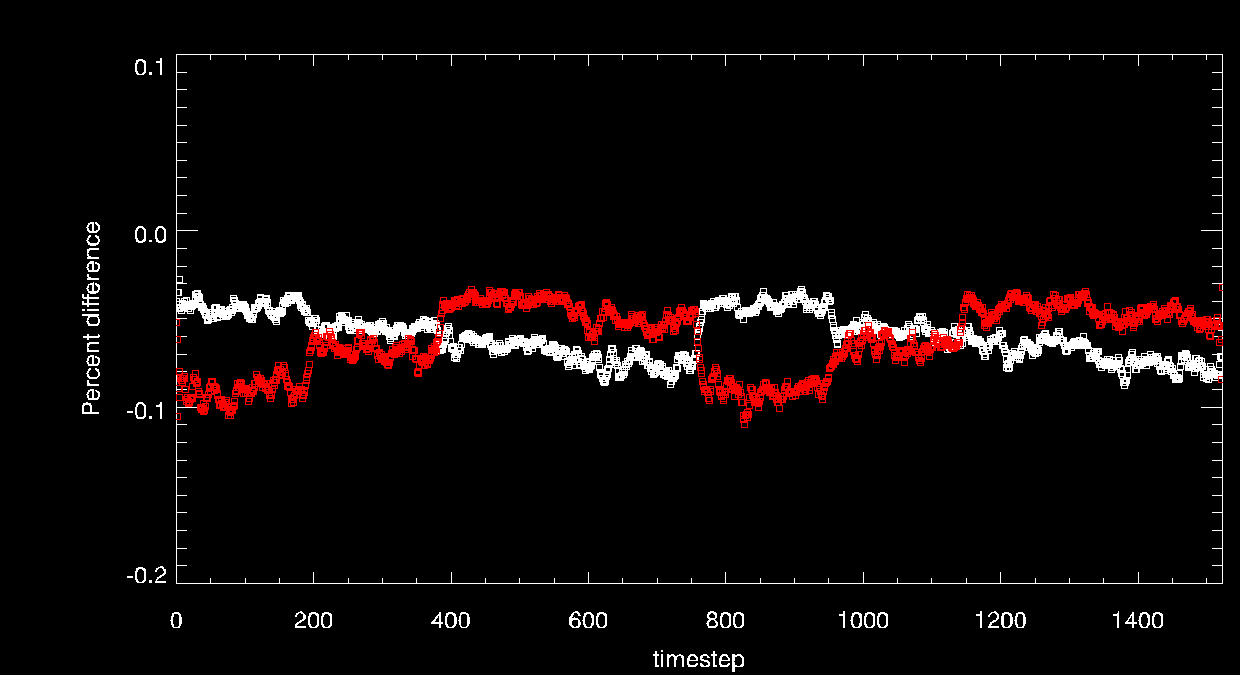
When using the command line lightcurve (installed with pip, updated to version 0.6.2) I found slight percentage differences between lightcurves for the same dataset generated in January 2018 vs. data generated by Justin in a Python session in February 2017. CalCOS has changed in the interim but I am also wondering if there is a difference between the command line script and what Justin used. Here is a plot of the differences with the dataset (WD 1145+017, February 2017) with percentage difference vs. timestep. I calculated it for segment B of COS (red points) and segment A (white points) with a boxcar smoothing of 11 timesteps. There seems to be a slight variation with FP-POS of COS.
When using the command line lightcurve (installed with pip, updated to version 0.6.2) I found slight percentage differences between lightcurves for the same dataset generated in January 2018 vs. data generated by Justin in a Python session in February 2017. CalCOS has changed in the interim but I am also wondering if there is a difference between the command line script and what Justin used. Here is a plot of the differences with the dataset (WD 1145+017, February 2017) with percentage difference vs. timestep. I calculated it for segment B of COS (red points) and segment A (white points) with a boxcar smoothing of 11 timesteps. There seems to be a slight variation with FP-POS of COS.
