This is regarding the check_outliers() paper for the journal Mathematics (easystats/performance#544). I wonder if we should add new plot methods to include in the article submission (deadline is Feb 23). I explain in detail below.
Model-based outliers
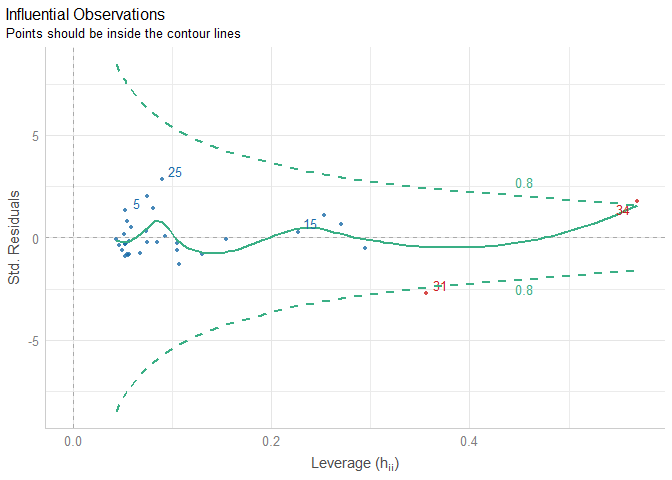
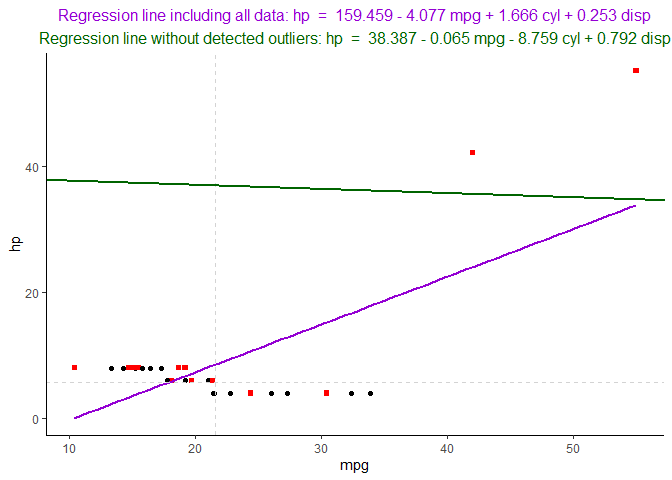
For model-based outliers, see has an awesome plotting method:
library(performance)
library(see)

data <- rbind(mtcars[1:4], 42, 55)
model <- lm(disp ~ mpg * hp, data = data)
x <- check_outliers(model, method = "cook")
plot(x)
Created on 2023-01-20 with reprex v2.0.2
Multiple methods
For multiple methods, we have no choice but to standardize the distance scores if we want to plot them on the same scale so I think the current solution is pretty satisfying.
library(performance)
library(see)

data <- rbind(mtcars[1:4], 42, 55)
model <- lm(disp ~ mpg * hp, data = data)
x <- check_outliers(data, method = c("zscore_robust", "iqr", "mcd", "lof"))
plot(x)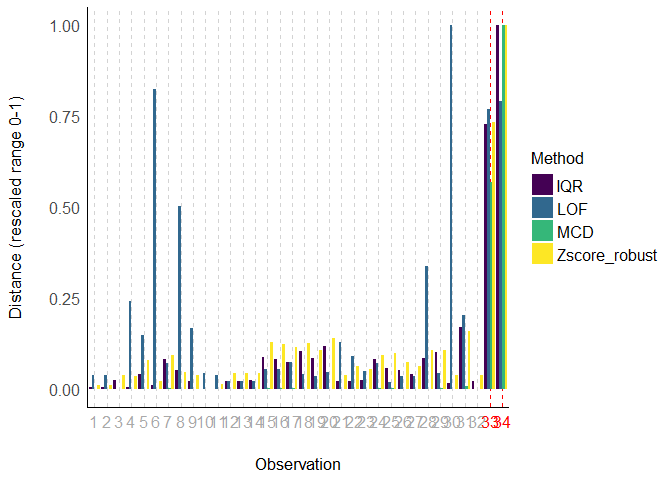
Created on 2023-01-20 with reprex v2.0.2
Multivariate methods
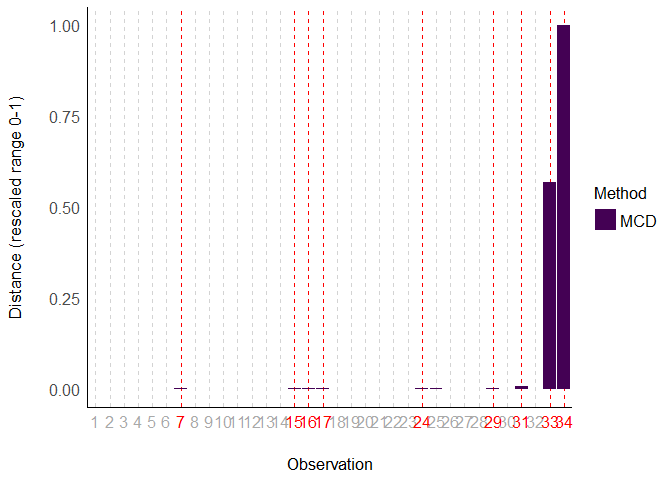
For a single multivariate method, I think it is ok-ish. Could be a lot of work to do a custom plotting method for each multivariate method so I think this is fine. But the x-axis is hard to read since the numbers overlap (so imagine with big data sets).
library(performance)
library(see)

data <- rbind(mtcars[1:4], 42, 55)
model <- lm(disp ~ mpg * hp, data = data)
x <- check_outliers(data, method = "mcd")
plot(x)
Created on 2023-01-20 with reprex v2.0.2
For the Mahalanobis method specifically, one colleague believes their own custom plot is more useful (and would be happy to see it implemented within easystats):
data <- rbind(mtcars[1:4], 42, 55)
data <- cbind(car = row.names(data), data)

mahaout <- function (dataset, vars, idvar) {
  maha <- as.data.frame(na.omit(dataset[, c(idvar, vars)]))
  maha$values <- mahalanobis(na.omit(dataset[, vars]),
                             colMeans(na.omit(dataset[,vars]), na.rm=T),
                             cov(na.omit(dataset[, vars]), use = "p"))
  crit <- qchisq(0.999, df = ncol(dataset[, vars]))
  plot(sort(maha$values),
       xlab = "Observations", ylab = "Mahalanobis values")
  abline(h = crit, col = "darkred")
  outliers <- maha[which(maha$values > crit), idvar]
  return(outliers)
}

mahaout(data, vars = names(data[-1]), idvar="car")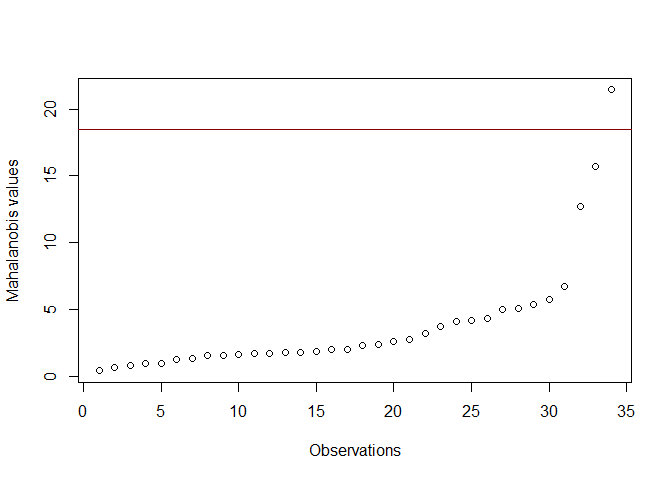
Created on 2023-01-20 with reprex v2.0.2
Should we have something like that for method = mahalanobis and similar ones? The guiding principle could be: plotting distance of individual observations + line at chosen threshold. If we do this it might not be that much work since the actual distances and thresholds are already accessible as attributes, so it would make for very consistent plotting.
Lakens's Method
Edit: forgot to add this other example: Alternatively, we have the plot outlier method from the Daniel Lakens's outliers paper (Leys et al. (2019)).
library(Routliers)

data <- rbind(mtcars[1:4], 42, 55)
res <- outliers_mcd(x = data)
plot_outliers_mcd(res, x = data)
Created on 2023-01-20 with reprex v2.0.2
Univariate methods
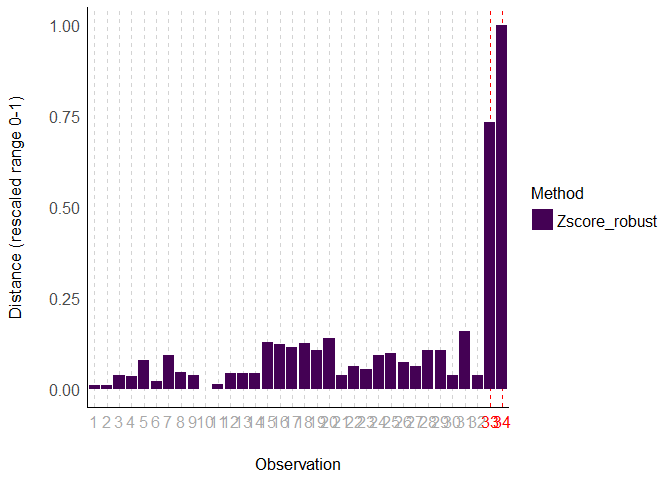
Let me give you another example of mine for univariate outliers. Currently, we have the same boring plot for method = zscore_robust for instance.
library(performance)
library(see)

data <- rbind(mtcars[1:4], 42, 55)
x <- check_outliers(data, method = "zscore_robust")
plot(x)
Created on 2023-01-20 with reprex v2.0.2
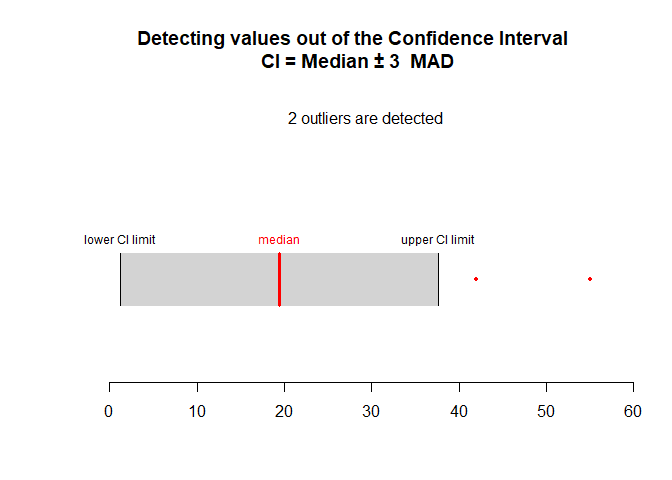
But I was imagining that perhaps it would be useful to use something like this for zscores:
library(rempsyc)

data <- rbind(mtcars[1:4], 42, 55)
plot_outliers(data, response = "mpg", method = "sd", criteria = 3)
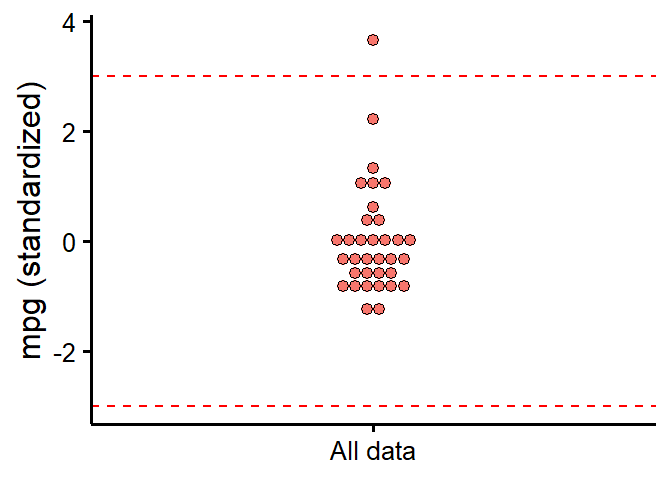
Created on 2023-01-20 with reprex v2.0.2
And something similar for robust zscores, but for several variables we could also wrap it in a panel:
library(rempsyc)
library(see)
data <- rbind(mtcars[1:4], 42, 55)
plots(lapply(names(data), function(x) {
  plot_outliers(data, response = x, ytitle = x, method = "mad", criteria = 3)
}), n_columns = 2)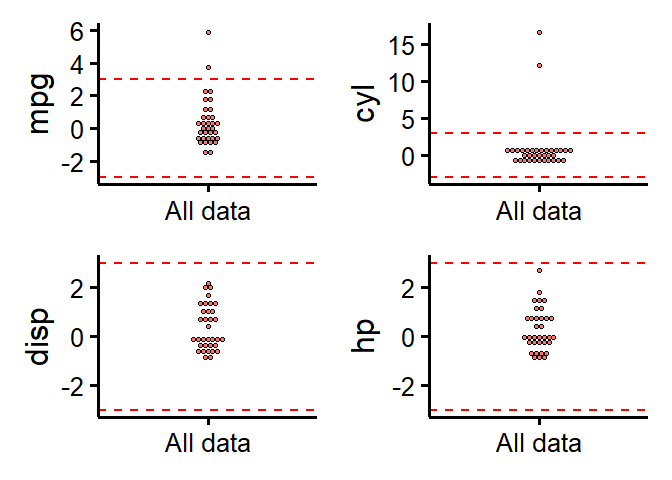
Created on 2023-01-20 with reprex v2.0.2
Lakens's Method
Edit: forgot to add this other example: Alternatively, we have the plot outlier method from the Daniel Lakens's outliers paper (Leys et al. (2019)).
library(Routliers)

data <- rbind(mtcars[1:4], 42, 55)
res <- outliers_mad(x = data$mpg)
plot_outliers_mad(res, x = data$mpg)
Created on 2023-01-20 with reprex v2.0.2
Challenges
One possible challenge for univariate method is when applied to several columns. In that case the proposed solution will not work since the rescaled score (0-1) is an aggregate of the score of each column (for single multivariate methods that would not be a problem by definition). So we could implement this when a single method + single column are selected? Unless of course we use lapply with see:plots like in the last example.
This is regarding the
check_outliers()paper for the journal Mathematics (easystats/performance#544). I wonder if we should add new plot methods to include in the article submission (deadline is Feb 23). I explain in detail below.Model-based outliers
For model-based outliers,
seehas an awesome plotting method:Created on 2023-01-20 with reprex v2.0.2
Multiple methods
For multiple methods, we have no choice but to standardize the distance scores if we want to plot them on the same scale so I think the current solution is pretty satisfying.
Created on 2023-01-20 with reprex v2.0.2
Multivariate methods
For a single multivariate method, I think it is ok-ish. Could be a lot of work to do a custom plotting method for each multivariate method so I think this is fine. But the x-axis is hard to read since the numbers overlap (so imagine with big data sets).
Created on 2023-01-20 with reprex v2.0.2
For the Mahalanobis method specifically, one colleague believes their own custom plot is more useful (and would be happy to see it implemented within
easystats):Created on 2023-01-20 with reprex v2.0.2
Should we have something like that for
method = mahalanobisand similar ones? The guiding principle could be: plotting distance of individual observations + line at chosen threshold. If we do this it might not be that much work since the actual distances and thresholds are already accessible as attributes, so it would make for very consistent plotting.Lakens's Method
Edit: forgot to add this other example: Alternatively, we have the plot outlier method from the Daniel Lakens's outliers paper (Leys et al. (2019)).
Created on 2023-01-20 with reprex v2.0.2
Univariate methods
Let me give you another example of mine for univariate outliers. Currently, we have the same boring plot for
method = zscore_robustfor instance.Created on 2023-01-20 with reprex v2.0.2
But I was imagining that perhaps it would be useful to use something like this for zscores:
Created on 2023-01-20 with reprex v2.0.2
And something similar for robust zscores, but for several variables we could also wrap it in a panel:
Created on 2023-01-20 with reprex v2.0.2
Lakens's Method
Edit: forgot to add this other example: Alternatively, we have the plot outlier method from the Daniel Lakens's outliers paper (Leys et al. (2019)).
Created on 2023-01-20 with reprex v2.0.2
Challenges
One possible challenge for univariate method is when applied to several columns. In that case the proposed solution will not work since the rescaled score (0-1) is an aggregate of the score of each column (for single multivariate methods that would not be a problem by definition). So we could implement this when a single method + single column are selected? Unless of course we use
lapplywithsee:plotslike in the last example.