It would be great to add:
- an overall statistical test to check if there is any time effect overall
- a function to plot the outcome of null simulations tailored to one data to explore variation expected under random
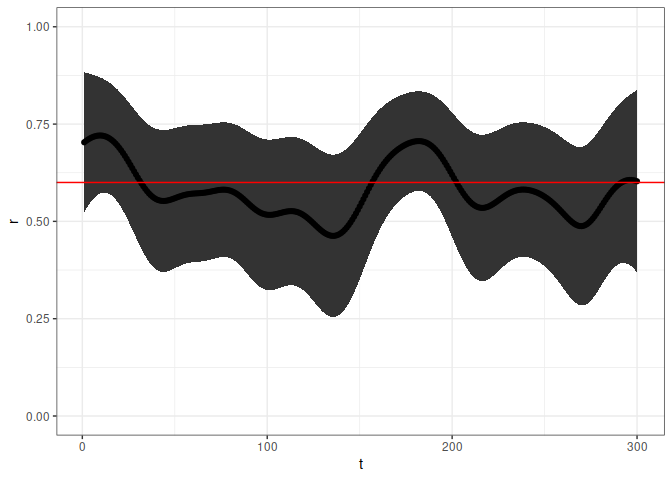
Here is a piece of code that I created on the fly to answer a question from @isabellaghement.bsky.social; it shows a null simulation (nb: the red marks the fixed expectation):
## simulation with 2 variables showing a constant correlation level

library(tidyverse)
library(timevarcorr)
#> timevarcorr loaded; type ?tcor for help on this package.
options(mc.cores = 8)

n_time_steps <- 300
r_assumed <- 0.6

set.seed(1)

cov_matrix <- matrix(c(1, r_assumed, r_assumed, 1), nrow = 2, ncol = 2) # NB: here cov = cor
mvtnorm::rmvnorm(n_time_steps, sigma = cov_matrix) |>
  as.data.frame() |>
  mutate(t = seq_len(n_time_steps)) |>
  mutate(tcor(V1, V2, t, CI = TRUE, kernel = "normal")) -> test
#> h selected using LOO-CV = 138.2
#> h selected using elbow criterion = 35.1
#> Bandwidth automatic selection completed in 6.5 seconds

ggplot(test, aes(y = r, x = t, ymin = lwr, ymax = upr)) +
  geom_ribbon() +  geom_line() + geom_point() +
  geom_hline(yintercept = r_assumed, colour = "red") +
  ylim(0, 1) + theme_bw()
Created on 2023-11-10 with reprex v2.0.2
It would be great to add:
Here is a piece of code that I created on the fly to answer a question from @isabellaghement.bsky.social; it shows a null simulation (nb: the red marks the fixed expectation):
Created on 2023-11-10 with reprex v2.0.2