Colors & Colorbars
On this page are examples of how QOL.plots can help you deal with colors & colorbars:
- Determine the Nth color...
- Create a nice colorbar (default)
- Create a well-labeled colorbar for discrete data
- Create a discrete colormap
- Show all available colormap options
Before running any of the following examples, make sure to do:
import matplotlib.pyplot as plt
import numpy as np
import QOL.plots as pqolpqol.Nth_color(n) #n should equal a nonnegative integer, e.g. n=0, or n=7.This returns the Nth color in the default color cycle, which is the thing that determines colors when you plot multiple datasets on the same image.
For example, you can use this function to manually choose colors that match the default color cycle, or mix it up however you want:
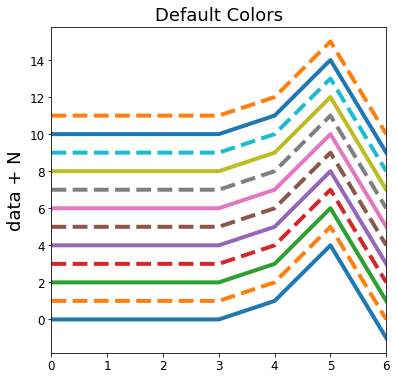
data = np.array([0,0,0,0,1,4,-1]) #make some data
## Default plot ##
title = "Default Colors"
for N in range(12):
linestyle = '-' if (i % 2 ==0) else '--' #dotted every other line.
plt.plot(N + data, label=N, linestyle=linestyle, linewidth=4)
plt.ylabel("data + N") #formatting/labelling
plt.title(title) #formatting/labelling
plt.xlim([0,len(data)-1]) #formatting/labelling
plt.show()
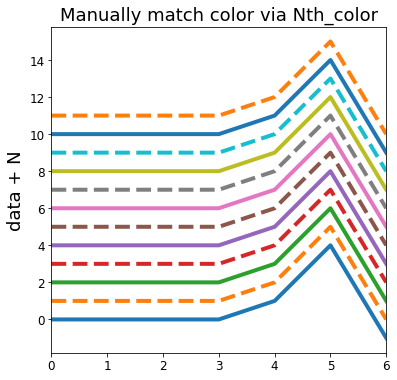
## Plot with manually matched colors ##
title = "Manually match color via Nth_color"
for N in range(12):
linestyle = '-' if (i % 2 ==0) else '--' #dotted every other line.
plt.plot(N + data, label=N, linestyle=linestyle, linewidth=4,
color=pqol.Nth_color(N)) #this part is different from above
plt.ylabel("data + N") #formatting/labelling
plt.title(title) #formatting/labelling
plt.xlim([0,len(data)-1]) #formatting/labelling
plt.show()
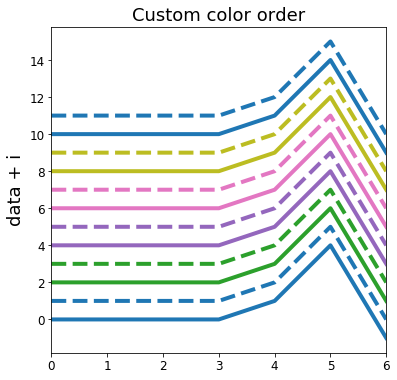
## Plot with selected color order ##
title = "Custom color order"
color_order = [0,0,2,2,4,4,6,6,8,8,10,10] #this line is new
for i in range(12):
linestyle = '-' if (i % 2 ==0) else '--' #dotted every other line.
plt.plot(i + data, label=N, linestyle=linestyle, linewidth=4,
color=pqol.Nth_color(color_order[i])) #this part is different from above
plt.ylabel("data + N") #formatting/labelling
plt.title(title) #formatting/labelling
plt.xlim([0,len(data)-1]) #formatting/labelling
plt.show()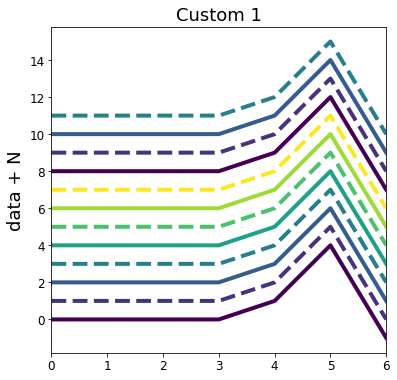
data = np.array([0,0,0,0,1,4,-1]) #make some data
title = "Custom 1"
cmap = 'viridis' #colormap string or colormap object
n_discrete = 8 #number of colors in discrete colormap
for N in range(12):
linestyle = '-' if (N % 2 ==0) else '--' #dotted every other line.
plt.plot(N + data, label=N, linestyle=linestyle, linewidth=4,
color=pqol.Nth_color(N, cmap, n_discrete)) #here is Nth_color function
plt.ylabel("data + N") #formatting/labelling
plt.title(title) #formatting/labelling
plt.xlim([0,len(data)-1]) #formatting/labelling
plt.show()
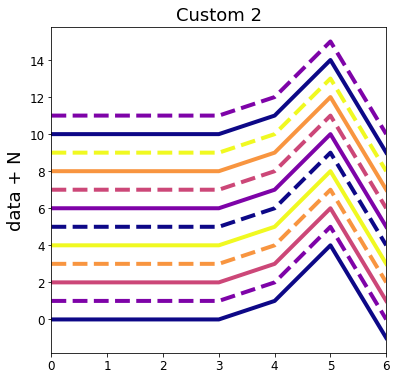
title = "Custom 2"
cmap = 'plasma' #only differences (1/2) from custom 1
n_discrete = 5 #only differences (2/2) from custom 1
for N in range(12):
linestyle = '-' if (N % 2 ==0) else '--' #dotted every other line.
plt.plot(N + data, label=N, linestyle=linestyle, linewidth=4,
color=pqol.Nth_color(N, cmap, n_discrete)) #here is Nth_color function
plt.ylabel("data + N") #formatting/labelling
plt.title(title) #formatting/labelling
plt.xlim([0,len(data)-1]) #formatting/labelling
plt.show()You can even pass a list of integers to Nth_color, in which case it will return a list of colors. For example, you could rewrite the for loop from the last bit of code, to look like:
#...
listN = range(12)
colors = pqol.Nth_color(listN, cmap, n_discrete) #note this is outside the loop
for N in listN:
    linestyle = '-' if (N % 2 ==0) else '--'
    plt.plot(N + data, label=N, linestyle=linestyle, linewidth=4,
             color=colors[N])                    #this line is different from before.
#...
This will produce the same exact output as before. Note that it will be slightly more efficient, too! (If you care about efficiency for plotting: repeatedly running pqol.Nth_color(N, cmap, n_discrete) will create a new discrete colormap each time the function is called. Calling the function with a list of integers instead of a single-valued N will mean the discrete colormap is created only once. Alternatively, you can use cm = pqol.discrete_cmap(n_discrete, cmap) then pqol.Nth_color(N, cm) to ensure the colormap is created only once.
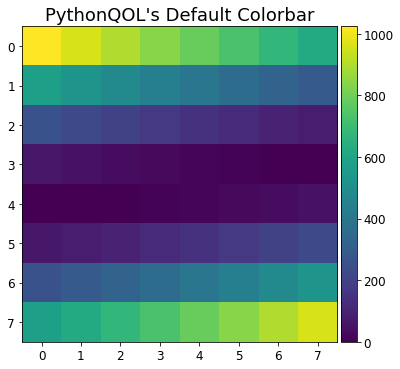
pqol.colorbar()For comparison, below are images showing matplotlib's default colorbar and PlotQOL's default colorbar.
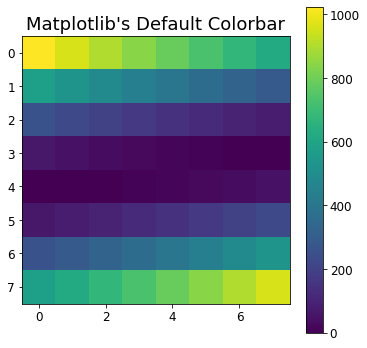
plt.imshow((np.arange(64).reshape(8,8) - 32)**2)
plt.title("Matplotlib's Default Colorbar")
plt.colorbar()
plt.show()

plt.imshow((np.arange(64).reshape(8,8) - 32)**2)
plt.title("PythonQOL's Default Colorbar")
pqol.colorbar() #Note it is pqol.colorbar(), not plt.colorbar().
plt.show()data = ... #your data goes here
pqol.discrete_imshow(data, colorbar=True)Below are some examples of using pqol.discrete_imshow, and matplotlib's imshow for comparison.
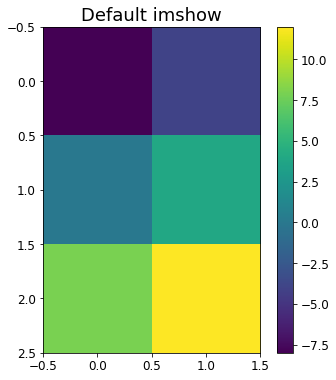
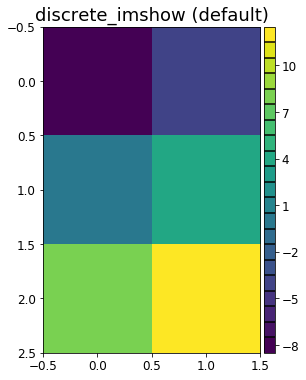
image_data = np.array([[-8,-4],[0,4],[8,12]])

## Default matplotlib imshow ##
plt.imshow(image_data)
plt.title("Default imshow")
plt.colorbar()
plt.show()

## Default PlotQOL discrete_imshow ##
pqol.discrete_imshow(image_data, do_colorbar=True)
plt.title("discrete_imshow (default)")
plt.show()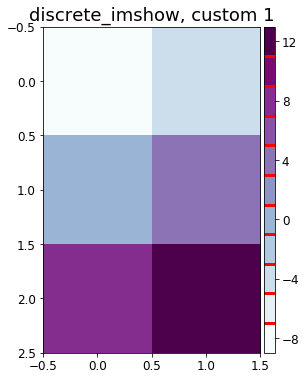
image_data = np.array([[-8,-4],[0,4],[8,12]]) #same data in prior example
## PlotQOL discrete_imshow, custom 1 ##
colormap = 'BuPu' #colormap. first 2 plots were 'viridis' by default.
cgrid=dict(color='gold', #gridlines of colorbar - color.
linewidth=3 ) #gridlines of colorbar - linewidth.
stepsize = 2 #discrete step size. == 1 by default.
pqol.discrete_imshow(image_data, base_cmap=colormap, step=stepsize,
do_colorbar=True, cgrid_params=cgrid)
plt.title("discrete_imshow, custom 1")
plt.show()
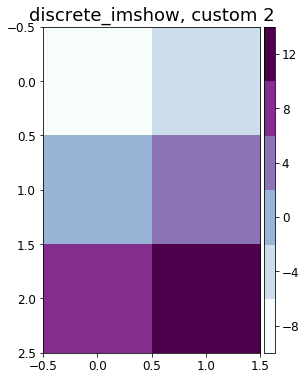
## PlotQOL discrete_imshow, custom 2 ##
colormap = 'BuPu' #colormap. first 2 plots were 'viridis' by default.
cgrid=dict(grid=False) #gridlines of colorbar - removed.
stepsize = 4 #discrete step size. == 1 by default.
pqol.discrete_imshow(image_data, base_cmap=colormap, step=stepsize,
do_colorbar=True, cgrid_params=cgrid)
plt.title("discrete_imshow, custom 2")
plt.show()For further customization consider combining the pqol.colorbar(discrete=True) and pqol.discrete_cmap() functions.
discrete_imshow and Nth_color examples above is the discrete_cmap function. Most users will not need to use this function direction, but rather may prefer to call the functions from the previous examples.
In its most basic form, creating a discrete colormap is accomplished by:
pqol.discrete_cmap(N, cmap) #N=number of colors, cmap = colormap object, string, or NoneThis will create a discrete colormap with N colors, interpolated based on the colormap represented by cmap:
- If
cmapisNone, uses the default colormap (plt.cm.get_cmap(None), likely'viridis'). - If
cmapis a string, uses matplotlib's colormap represented by that string. * - If
cmapis a colormap, uses cmap itself.
*See the "Show all available colormap options" example, below.
QOL/plots solves this by adapting the example from that page, to let you reproduce the image of all the colormap options.
In its simplest form, showing all available colormap options is accomplished by:
pqol.colormaps()This will print all the default colormaps available, as per the example in matplotlib's online documentation.
For more advanced usage, you may enter any keywords that are accepted by plt.imshow. For example, to see what all the colormaps look like when mostly transparent, you could do pqol.colormaps(alpha=0.3)