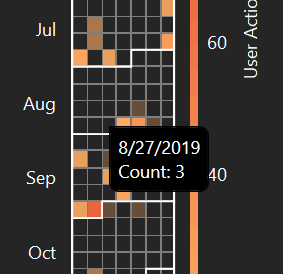
The linear color axis used to assign colors to the cells of the Event Timeline Calendar Heatmap can make it difficult to distinguish between days that contain 0 events and days that contain a few events. When the color axis range is sufficiently wide (0 to 100 user actions), days with 1-5 events are often assigned the 'transparent' color, making them appear empty. The linear color axis used to render the heatmap should be replaced with a custom axis that clearly distinguishes days where 0 events occurred from days where 1 or more events occurred.
The linear color axis used to assign colors to the cells of the Event Timeline Calendar Heatmap can make it difficult to distinguish between days that contain 0 events and days that contain a few events. When the color axis range is sufficiently wide (0 to 100 user actions), days with 1-5 events are often assigned the 'transparent' color, making them appear empty. The linear color axis used to render the heatmap should be replaced with a custom axis that clearly distinguishes days where 0 events occurred from days where 1 or more events occurred.